Dogecoin: DBeS2gHm79fHsxkYWTatbCYonxxc8fQn4M
Bitcoin: bc1qga4p8wxjvc8vx2l9p5y35ac7t0q0jqf8lmsf9y

Wednesday, May 17, 2023

Automated Trading Strategies: Q1 2023 Portfolio Update

The current backtested portfolio made $5.2m from April 2022 to April 2023. The portfolio made $219/trade on 24K trades (94 trades/day), had a max drawdown of $1.3m and profit factor of 1.48.

In case you didn’t know, we’re on the hunt for the holy grail of automated trade strategy. I define the holy grail of trade strategy as having the following attributes:

  • Profit factor (gross profit/gross loss) greater than 3
  • Annual max drawdown less than 3%
  • Annual return greater than 500%
  • Maximum daily low of -$1,000
  • Avg Daily profit greater than $1,000
  • Less than 5,000 trades annually
  • Greater than 253 trades annually

Every few months I like to look at how our top automated trading strategies are performing and update you on key findings, highlights, takeaways and what’s in the pipeline. I’ll be transitioning to quarterly updates going forward. This is the Q1 2023 update.

Thursday, April 20, 2023

Futures Vs. Stocks: $LULU, $VRSK, $SPLK, $AAPL, $CTAS, $ORLY, and $TSLA performed particularly well with certain strategies

Important: There is no guarantee that our strategies will have the same performance in the future. We use backtests to compare historical strategy performance. Backtests are based on historical data, not real-time data so the results we share are hypothetical, not real. There are no guarantees that this performance will continue in the future. Trading is extremely risky. If you trade futures live, be prepared to lose your entire account. We recommend using our strategies in simulated trading until you/we find the holy grail of trade strategy.


woman wearing sneaker and sandal
Photo by ZUZANA on Unsplash

We haven’t found the holy grail of automated trade strategy yet, but we get closer with every strategy. Click here for the most recent performance chart and links to all strategy descriptions.

While our focus is primarily on futures, I wanted to take a moment to answer a question that I get at least once a week: Do your strategies work on stocks?

Personally, I invest in stocks and crypto, and trade futures. In other words, I buy and hold stocks/crypto and day trade futures, primarily equity futures.

Why do I prefer trading futures?

Futures are highly liquid, which increases price action. Margin requirements are also fairly low compared to the assets you have control over, which means you have considerable leverage. Short selling is much easier in futures and you can trade 23 hours a day, six days a week. Last but not least, from a tax perspective, capital gains follow the 60/40 rule and there is no wash sale rule—all your trades are combined and you either make a gain or loss at the end of the year.

So why are we looking at stocks?

Aside from the fact that a backtest using stocks is a common request, there are more stocks than futures, which means there are more markets to choose from. That also means there’s more opportunity to find a stock that works well with a particular strategy. In general, we use 10-15 different futures contracts, but there are over 3,000 stocks listed on the NASDAQ alone. Each one of those stocks has a defined market.

A semi-exhaustive experiment would include running all 62 of our strategies against all 3,000+ stocks on the NASDAQ to see which ones have the best performance (win rate > 90%, profit factor > 5, and trade count of 5 or more). That would take a lot of time, so we’re just going to look at the stocks that make up the NASDAQ-100.

Stock Performance

I started off by looking at just five stocks to see which strategies performed well. Then I ran the strategies that performed the best on all 100 stocks in the NASDAQ-100. The following results are a sample of those results.

The backtest is based on trading 100 shares of each stock from February 1, 2022 to February 1, 2023 using a daily bar chart:

Subscribers, go to original post and scroll to the bottom for a chart that includes Strategy #’s and parameters.

I’ve highlighted some of the stocks with more noteworthy performance. LULU, VRSK, SPLK, AAPL, CTAS, ORLY and TSLA performed particularly well (win rate > 90%) with certain strategies.

Again, this is the first time we’ve looked at stocks. We’ll be looking at more stocks over the next month or so with the hope of adding a few to the forward test.

If you have any questions please contact me at:

AutomatedTradingStrategies@protonmail.com

ATS does not provide tax, legal or accounting advice. This material has been prepared for informational purposes only, and is not intended to provide, and should not be relied on for, tax, legal or accounting advice. You should consult your own tax, legal and accounting advisors before engaging in any transaction.


Monday, September 5, 2022

Federal Reserve Chair Powell Gives Business Leaders at Jackson Hole A Call-To-Action: 'The Fed Won't Lower Prices Until You Do'

If you're wondering what sent the markets into free-fall, it was Federal Reserve Chair Jerome H. Powell's speech. He essentially told a group of business leaders at Jackson Hole that he was going to raise prices on debt until they (business leaders) lowered prices for the average consumer and/or increased wages for the average worker. It didn't go over well.

Wednesday, August 3, 2022

Automated Trading Strategies (ATS) Newsletter: Portfolio Update

In case you didn’t know, we’re on the hunt for the holy grail of automated trade strategy. We define the holy grail of trade strategy as having the following attributes:

  • Profit factor (gross profit/gross loss) greater than 3
  • Annual max drawdown less than 3%
  • Annual return greater than 500%
  • Maximum daily low of -$1,000
  • Avg Daily profit greater than $1,000
  • Less than 5,000 trades annually
  • Greater than 253 trades annually

Every two months I like to look at how our top automated trading strategies are performing and update you on key findings, highlights, takeaways and what’s in the pipeline. This is our July 2022 update.

Monday, April 18, 2022

The Federal Reserve: This Is A "Time of Uncertainty"

A few weeks ago the post: A Time of Uncertainty was published by the US Federal Reserve. It is a speech made by John C. Williams, President and Chief Executive Officer at the Federal Reserve. The speech was made to an audience in Princeton, New Jersey at the Economic Policy Studies 2022 Spring Symposium.

The most fascinating part of this speech is the title because little in the speech sounds 'uncertain'. To the contrary, the speech sounds all but certain that the 'uncertainty' of today will be gone in roughly two years. 

You always know when an opponent is weak by how they act. Most in power act powerful when weak and weak when strong. You can tell when its the former by the rationale. If the argument sounds delusional, you know they are weak. Such is the case with this speech.

It lays bear the true sentiment of all leaders today -- they have no idea what's going on. In particular, those that lead cartels like the Federal Reserve. So, most leaders are engaged in an act of looking big because they are weak and uncertain about what's to come, but that does not stop them from action. While uncertainty will make the sage stand still, the leaders of today are quick to act. Despite their uncertainty, they give speeches like the one given by Williams at the Spring Symposium. 

Here's an excerpt from the speech, 

In the United States, we are now seeing elevated inflation across many categories of goods and services. Meanwhile, in Europe, which is heavily dependent on Russia for energy, rising prices of oil and natural gas are the biggest concern. And in the Middle East, there are fears of a wheat shortage, given the region's reliance on wheat from Russia and Ukraine.

I sense little uncertainty here. Where it all goes wrong, at least in my estimation, is in the expectation set. They are under the misguided belief that with a few sprinkles of monetary policy, all will be back to normal in a few years. They all believe they can simply kick the same can into the next decade by raising rates. Here's an excerpt from the same speech: 

The one bright spot regarding inflation is that longer-run inflation expectations remain well anchored. This anchoring is seen in both market-based measures of expected inflation and in surveys of households and economists. For example, the New York Fed's Survey of Consumer Expectations has fielded special survey questions on five-year-ahead inflation expectations since 2019, and these expectations have hardly budged since the start of the pandemic. In addition, the pass-through of inflation surprises to revisions in three-year-ahead inflation expectations is about half as large as it was before 2020. That is, medium-term inflation expectations in this survey are less responsive to inflation shocks than they were before the pandemic. 

With regard to "expectations" Williams is referring to the projections put out by the FOMC in the middle of March. And, these projections are based on “expectations”. Isn't this curious? Why are the economic solutions of the day based on the 'expectations of the uncertain'. Where most of us have come to a full stop, the Federal Reserve has interpreted the stop as a sign that all will be well in two years. And, these are the expectations that are being used to steer economic policy. It is bewildering. The bewilderment does not end here.

There is a belief that inflation is being fueled by demand for goods rather than increases in the money supply. Keynesian and other non-monetarist economists reject the notion that inflation can be caused by the Federal Reserve's increase of the money supply via debt monetizing programs like quantitative easing and rampant buy-back programs because to do so would be to admit that they caused the "uncertainty" of today. And, to be clear, that would be okay. It would certainly be preferable to  acting as though the current situation was caused by a lack of supply on goods. Does anyone truly believe, in this technological age of over supply and consumption, that the issue is one of lack? Williams does and goes on to say:

Our monetary policy actions, combined with those of other countries, will help bring demand for labor and products in closer alignment with available supply. As this reduction in demand-induced price pressures takes effect and supply constraints gradually ease, I anticipate inflation readings will begin to decline later this year, although this process will take time to fully play out. For 2022 as a whole, I expect PCE inflation to be around 4 percent, then decline to about 2½ percent in 2023, before returning close to our 2 percent longer-run goal in 2024. 

In other words, all of this is just a bad dream caused by increased demand for goods and services and it will all be over by 2024. Some might even call this delusional. I can only hope that this is his public stance and that privately he's buying commodities and gold for his own portfolio, because it is clear that the inflation that's coming, fueled by our obsession with growth, is not one that can be patted on the head or answered using a Keynesian demand/supply chart. I believe the biggest fear of the Federal Reserve is that the world will come to blame its policy actions on the creation of a long protracted depression for the market.

Tuesday, March 29, 2022

Automated Trading Strategies: March 2022 Portfolio Update: Over the last 12 months our top strategies made over $3.31M based on NT8 backtest results

It’s been well over a year since we started this. With every update, the data grows richer and our observations more insightful.

We all want to believe there’s a way to measure the forward strength of a model, but the best you can do is make predictions about the future based on strategy performance and then track that performance. We use profit factor as the primary basis for that prediction, but there are a host of other attributes we track in our search for the holy grail of automated trade strategy. In this update, I’m going to introduce another — average time in the market. I’m also going to introduce our new testing process.


Over the last 3 months those of us on the hunt have made many discoveries. I want to thank our subscribers for all your help and support in this project. 

One report I publish every week is the Mudder Report. I use the report as a way to review weekly performance and discuss any updates or announcements for the coming week. The primary goal of the report is threefold:

  • to compare weekly stats against annual stats
  • to develop a rubric/framework for a weekly strategy selection process
  • to test backtest results against actual results

It’s the last bullet point that’s recently stopped us in our tracks.

What we found has led to several changes including the introduction of the trading metric ‘average time in the market’. This metric is one way to measure a very special kind of risk that I like to refer to as backtest risk.

Backtest risk is not attached to the backtest engine or methodology, but rather the unique attributes of a strategy that make it more or less prone to inaccuracy in backtest results. It is something unique to each individual strategy. That is, each strategy has its own backtest risk.

What can ‘average time in the market’ tell us about backtest risk?

For some automated trading strategies (not all), the more time you’re in the market, the less risky the strategy is from a backtest perspective. This might sound counterintuitive — it certainly does for me as a day trader — but it makes sense when you’re using backtests as a test of performance for an automated strategy.

We’ve spent a lot of time improving the accuracy of our backtest methodology — you can read more about that in the post: What Are We Doing To Ensure Backtest Accuracy, but we’ve come to discover that there’s a need for further due diligence. To that end, we’ve hired someone to add additional testing to the hunt.

  1. The backtest is the first test.
  2. The second test is to run the strategy on a simulated live account on a virtual server that is run continuously. The server is located in Chicago to reduce data latency.
  3. The third test is to run the strategy on Collective2, a third-party app used for copy-trading. To learn more about Collective2, click here.

I like to work backwards, so my goal is to have at least 10 strategies that pass these three tests. And, I’ll be reporting out on the weekly performance of these tests every week in the Mudder Report. We’ll return to the original intent of the Mudder Report once we’ve vetted at least 10 strategies.

I’m not suggesting that strategies that don’t pass this ‘master’ test should be thrown out, but our main tool to assess strategy performance is the NT8 backtest engine. So, if we’re going to use the backtest as a way to identify high performing strategies, we need to focus on those strategies that perform like the backtest. This is just one way to better identify those strategies. I can show you an updated version of our performance chart, and then compare that performance against the performance of our strategies one year ago, but what good does that do if the backtest results cannot be duplicated in live trading? As much as I don’t want to acknowledge it, there’s a gap and we’re turning that gap into something we can control. These two additional tests are the best way to do that without risking large amounts of capital.

The good news is that in our preliminary Collective2 tests, we’ve found that this issue only plagues certain strategies. In particular, those strategies with:

  • a high number of trades; and,
  • a short average time in the market.

Other strategies tend to be less prone to backtest inaccuracy; that is, they have a lower ‘backtest risk’. For example, Strategy 40 is performing exceptionally well on Collective2.

What does this mean? It means that some strategies, especially those strategies that enter and exit the market quickly, and by extension, have more than 3-4 trades per day, may be more prone to issues with backtest accuracy. We already track the average number of trades made per day. In our next performance update, we’re going to start tracking the average time trades are in the market.

Key takeaway: Those strategies with a higher ‘average time in the market’ and a lower ‘average trade count’ tend to have more reliable backtest results.

Now, let’s get back to our regularly scheduled programming.

We are on the hunt…

We are on the hunt for the holy grail of automated trade strategy. We define the holy grail of trade strategy as having the following attributes:

  • Profit factor greater than 3
  • Annual drawdown less than 3%
  • Annual return greater than 500%
  • Maximum daily low of -$1,000
  • Avg Daily profit greater than $1,000
  • Less than 5,000 trades annually
  • Greater than 253 trades annually

Every two months I like to look at how our top automated trading strategies are performing and update you on key findings, highlights, takeaways and what’s in the pipeline. The following post is our March 2022 update. You can view past updates here:

What Are We Looking For In These Updates

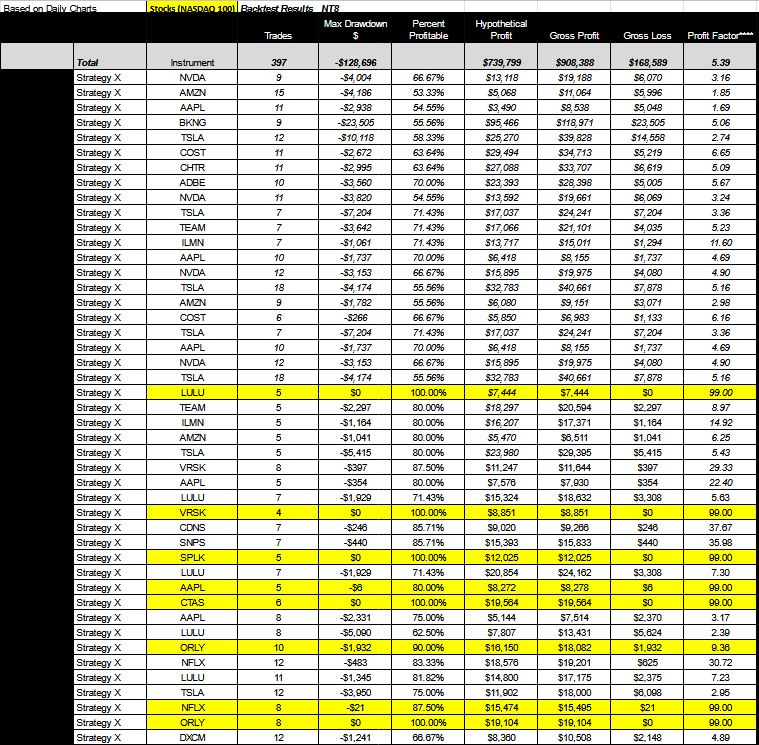
In our last update we culled the field a bit. At the end of the update we found ourselves with 27 out of 43 strategies:

Doing this allowed us to focus our efforts for future ATS Research. However, in light of our new testing process, we’re going to take a step back. I’ve asked for testing on all strategies on the virtual server. Those strategies that pass the test (and aren’t considered high frequency strategies like Strategy 3, 8 and 10), will be tested on Collective2 as well.

With that, let’s dive into the update.

January 2022 Vs. March 2022

So where do we stand in comparison with our last update?

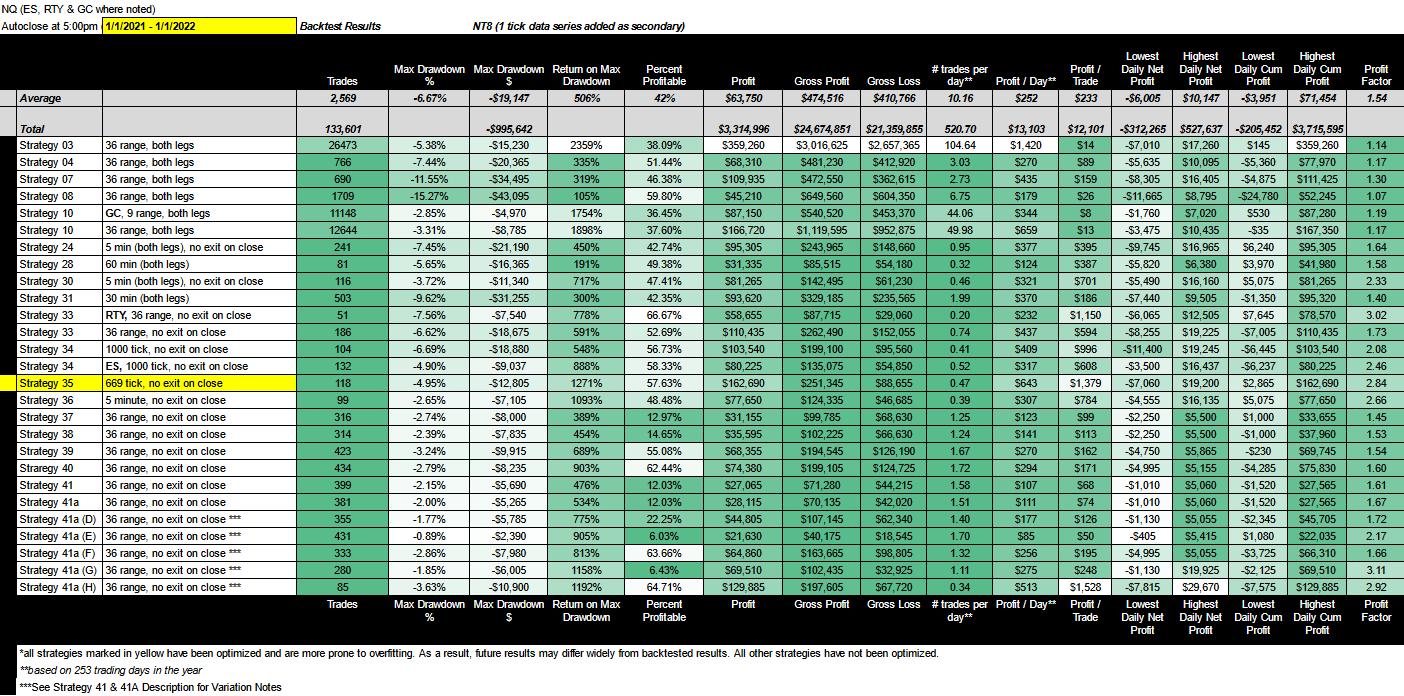
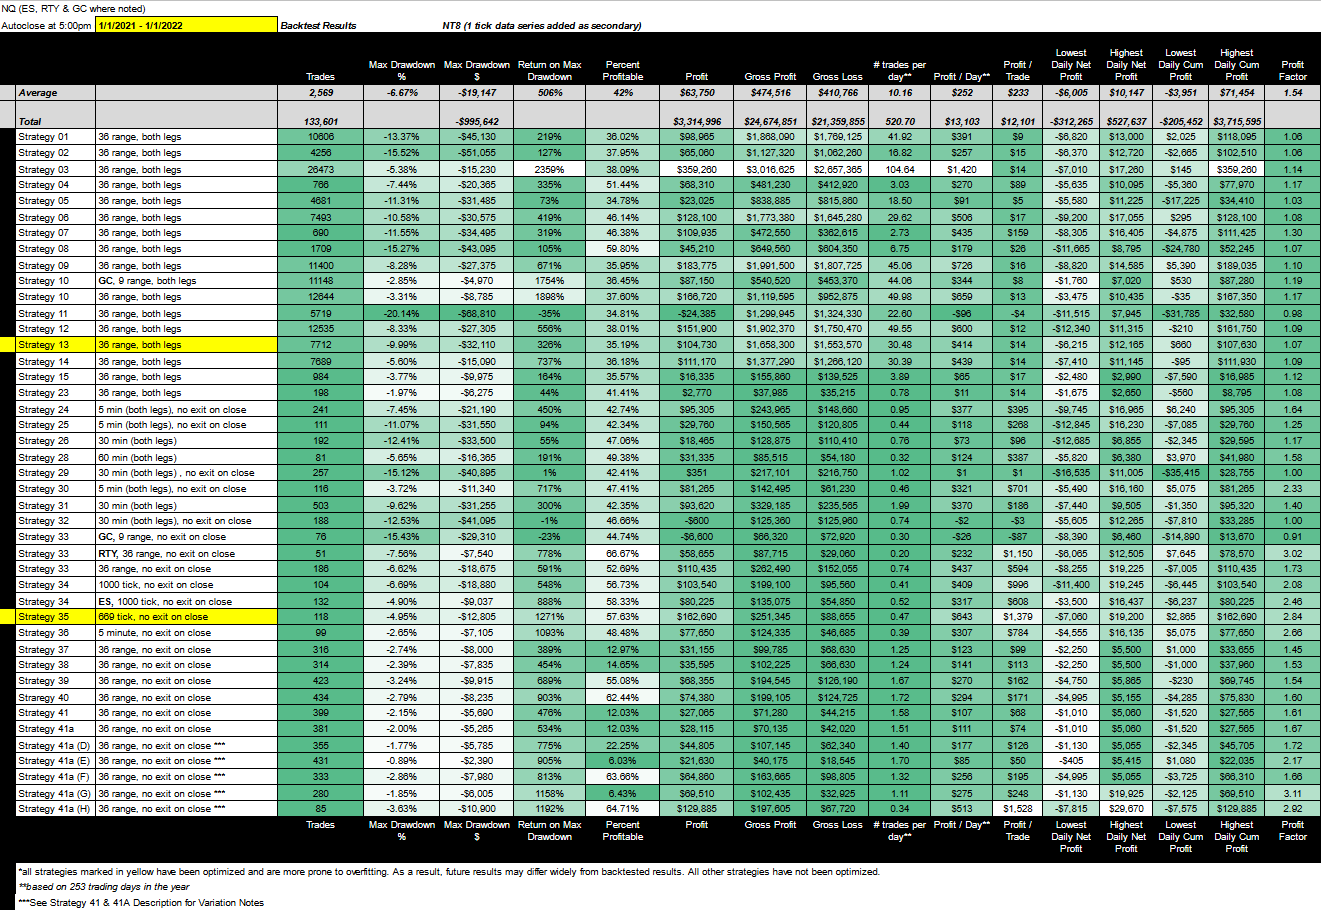
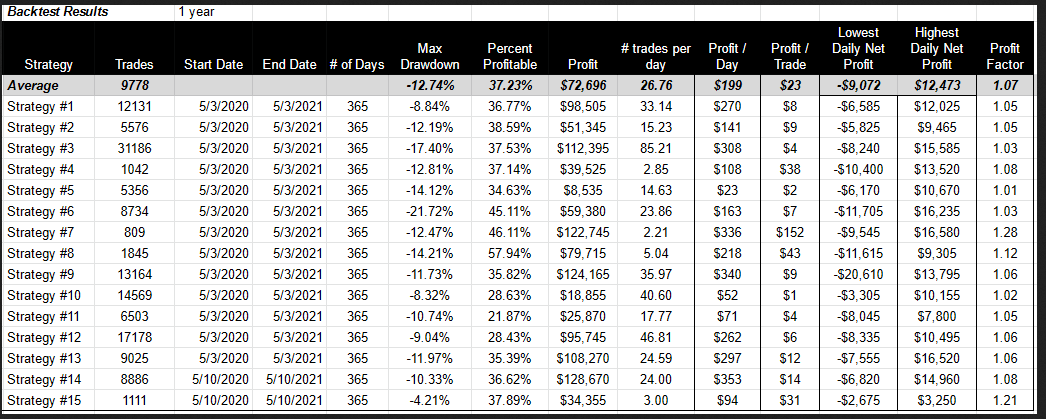
The table below provides the backtest results from our last update: 01/01/2021 - 01/01/2022

For the most recent update and links to all strategies click here.

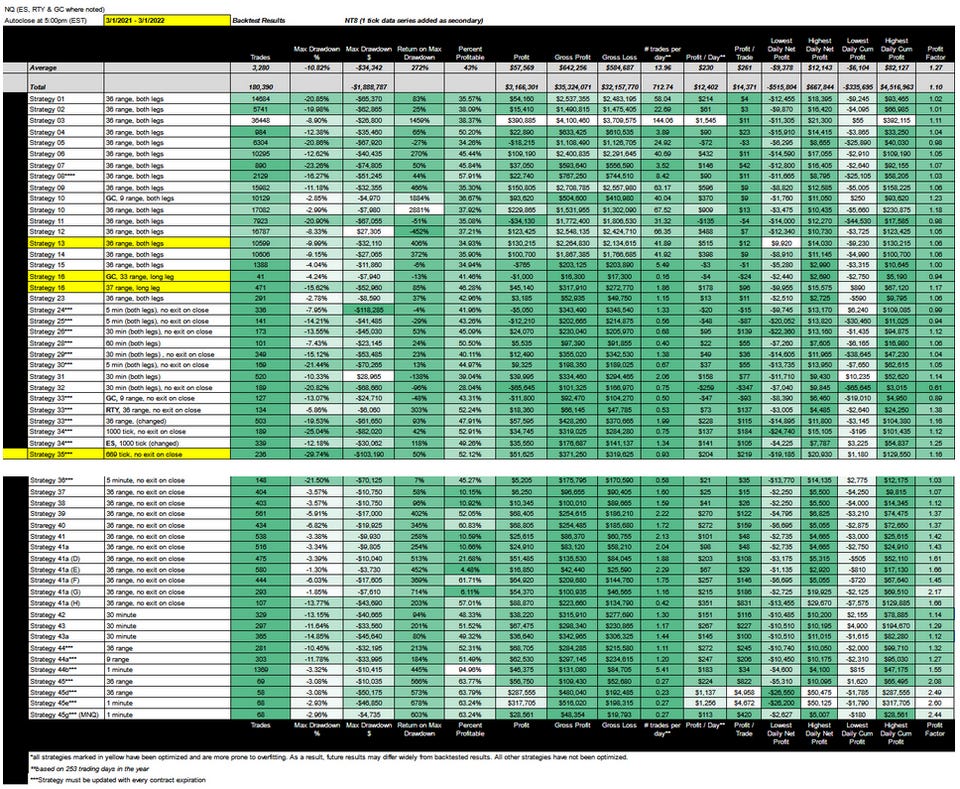
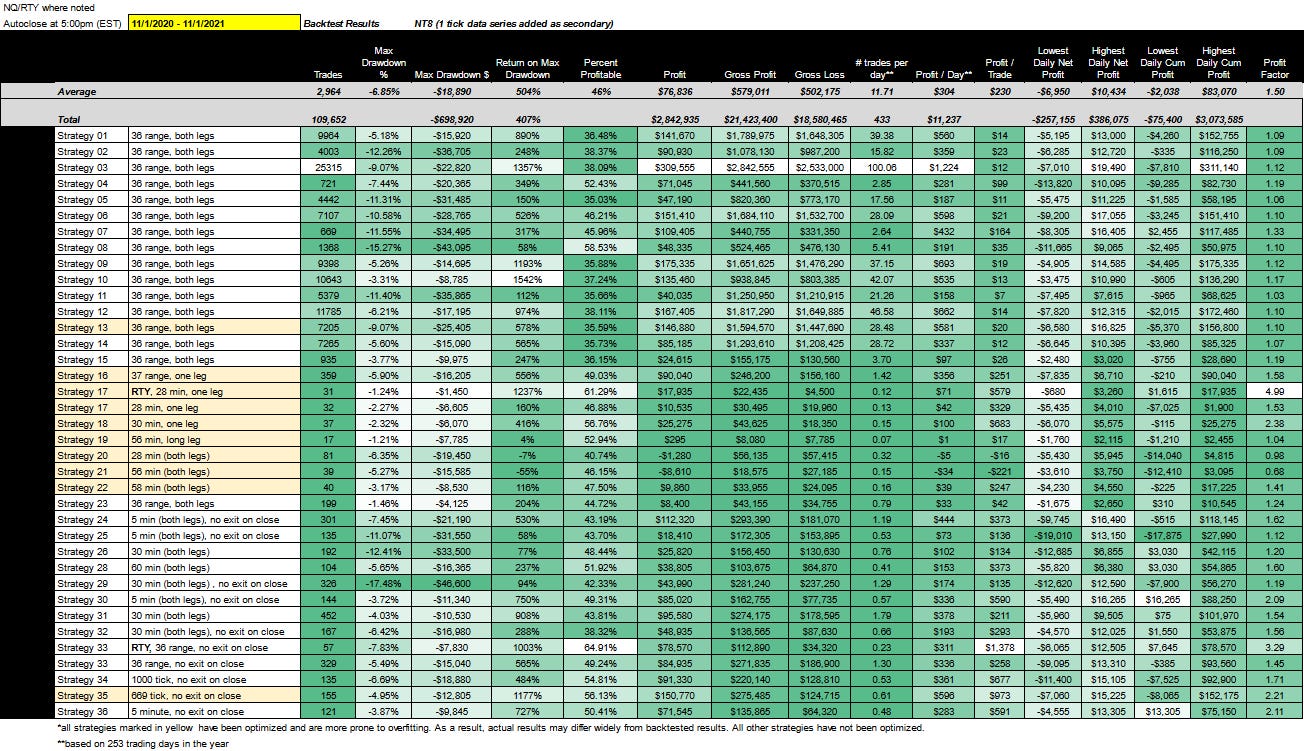
The following table provides the backtest results for the current or most recent update: 03/01/2021 - 03/01/2022

Strategies with less than 50 trades for the year were not included.

First, let’s review what the trend was coming into the March update.

  • In general, we had a deterioration from July to September of 2021. Profit per day decreased from $388 to $355 and profit per trade decreased from $145 to $116. Most of the deterioration occurred with optimized strategies. When we removed optimized strategies the metrics improved. What we’ve found over the year is that as much fun as optimized strategies are to ‘hunt’, they are more prone to overfitting and therefore have highly inconsistent results.

  • Moving into November of 2021, net profit for the total portfolio was basically flat, decreasing slightly from $2,788,075 to $2,746430, but the portfolio profit factor increased from 1.24 to 1.35 on fewer trades. Profit per day decreased from $355 to $304, but profit per trade increased from $116 to $230. Even though net profit decreased, it was a leaner and more efficient portfolio.

  • Moving into January of 2022, net profit for the total portfolio increased from $2.7 million to $3.3 million, and the portfolio profit factor increased from 1.50 to 1.54. In addition to a higher profit factor, we also have a slightly lower max drawdown percentage. Profit per day continued to decrease from $304 to $252.

  • Coming into March, net profit for the total portfolio decreased slightly from $3.3 million to $3.1 million and the profit factor decreased from 1.54 to 1.27. Trades increased by 25%. Drawdown increased dramatically from 6.67% to 10.82%. Profit per day continued to decrease from $252 to $230, but profit per trade increased from $233 to $261 due almost entirely to Strategy 45, the only strategy that incorporates a risk management strategy that trades more than one contract at a time.

So what’s going on?

On the whole, and as predicted, what we’re looking at is a much more volatile market. From an automated strategy perspective that translates into:

  • higher trade count
  • higher commissions
  • higher drawdowns
  • greater overall risk

While not evident when comparing the performance of the entire portfolio—our entire portfolio includes strategies that we would not consider in the weekly Mudder Report—on a weekly basis we’ve also noticed that volatility tends to create higher returns. Indeed, over the last four weeks we’ve seen a huge increase in volatility. Those of you that trade probably saw your margins increase by 2 to 3x. In that same time period, our weekly portfolio made nearly $600K in net income based on backtest results.

What’s causing this volatility?

Everyone has their own theory about what’s causing this volatility, and this is mine…

Central banks are stuck between a rock and a hard place. They are being forced to end asset buying programs (in hopes of tightening or slowing economic growth) while increasing rates. The programs were put in place to provide liquidity to an unstable market. But now growth, disguised as inflation, is fueling the push to increase rates. It is the economic equivalent of being catfished. Still, it seems that not even the uncertainty and volatility caused by ‘Russia’s invasion of Ukraine’ will deter the Fed from hiking. In total, the street is looking for six 25bp hikes this year and two more in 2023.

It’s important to remember that the Federal Reserve is the governing body for a banking cartel, not the United States. They only care about the state of the economy as it pertains to their bottom line, and we can’t fault them for this because we gave them this power. They are the anointed demigods of modern economic theory — too big to fail. And, the only thing that really hurts banks is inflation because fixed loans are paid back with dollars that have less value. It’s only natural to assume that the Federal Reserve will continue to raise rates even if it flies in the face of stable markets. 

So the big question on every banker’s mind right now is: how do we maintain liquidity while avoiding inflation? I don’t personally know how it can be done, but I’m sure they’ll invent something that pushes the inevitable down the road. 

The good news is that corporate CFOs have all gotten together and are currently attending a summit entitled: How To Adjust The Financial Statements So That The Effects of Inflation Can Be Readily Identified By Investors. No they aren’t. They don’t care as long as earnings are up. We’ll talk more about how to take advantage of these markets in a future Mudder Report.

One thing is certain, the hunt has changed since we started this project. The dark and scary forest of trading is full of volatility, rising rates and inflation, oh my. For now, the best thing we can do is continue to monitor results and adapt to a new norm. There is no going back to Kansas.

Update Summary

Scene from the movie “The NeverEnding Story”

One of my favorite teachers is Joseph Campbell. Perhaps his most famous work is the Power of Myth in which he outlines the hero’s journey as a mythology that is shared across time and cultures. It appears to be something that is ingrained in the human psyche. Every now and then the hero will find himself at a crossroads. Do you proceed or retreat?

Those of us that trade are on our own journey. The hunt for the holy grail of automated trade strategy is an extension of that journey. It is a journey that I take very seriously and we are currently at a kind of crossroads. We are not retreating. We are moving forward, but we have to be intellectually honest in the process.

I am aware that the new testing process may be seen by some as a setback, but it’s not. It may feel like we’re going backward, but we’re making sure we’re ready for what’s to come.

For the next two to three months we will be focused almost exclusively on testing each strategy. This pushes many of our other projects back a bit. For example:

  • In the first six months of 2022, we planned on including backtests for:

    • additional futures contracts like CL, FDAX, YM and bonds
    • FX and cryptocurrency
    • single stock picks
  • We were also looking into other platforms for our strategies as well as a few portfolio analysis options that might help to pull out additional insights for better strategy formulation.

All of these projects have been pushed, and I hope you understand why. Ultimately, we believe our new testing format will get us closer to the holy grail.

The key to finding the holy grail is to document, narrow and refine our approach, which is exactly what we’re doing. Our bi-monthly updates—like the one you are reading now—along with The Mudder Report and additional backtest research, are meant to share the process with you.

One thing is certain, we’re closer than we were last year and we couldn’t have done it without your support.

What’s in the pipeline:

This is where I usually tell you about the projects in the pipeline. This update is a bit different because we’ve already addressed that, but I can talk to you about what’s in the pipeline for strategy formulation. We post new strategies for subscribers on the 1st and 15th of every month.

If anything, what the Mudder Report has taught me is that events drive markets, not trends. Trends are nice to ride when you find one, but events are more reliable for planning purposes. To that end, I’ve ordered several event studies, the last of which was delivered today. Specifically, I asked the analyst for research pertaining to the NDX — the underlying instrument to the NQ — for the past 11 years. For example, did you know that:

  • Tuesday has the highest return (followed by Wednesday).
  • July has the highest return by month (followed by April and November) and that the only year that did not experience a positive month in July was July of 2014.
  • July also performs exceptionally well in election years (2012, 2016, 2020) at 76% returns and post elections cycles (2013, 2017, 2021) at 80%.
  • By contrast, July performs poorly in midterm election cycles (2014, 2018, 2022).

What’s one possible strategy to employ based on these observations? Go long on Tuesday’s in July, April and November of election years or post election years. 

There are over two dozen observations like these in the report and I’m going to summarize and share them with all subscribers over the next two to three weeks. We are working on creating a strategy that is driven by these event cycles. At some point, we would like to focus on event studies for specific stocks, but that project has been pushed to the end of 2022.

What else are we working on? We’re looking at:

  • creating strategies that attach orders to indicators.
  • strategies that have an input that is driven by a non-indicator based optimization, like day of week. So one part of the strategy is static and the other is based on an aspect that is updated on a daily or weekly basis.
  • creating more strategies that ramp up from 1 MNQ contract to 5 NQ contracts based on net income, like Strategy 45.
  • the individual performance of strategies at the weekly level to see if we can find more trends like we did with Strategy 40.

We’re also looking at creating a strategy based on the average true range (ATR). In most cases, prices tend to fall quickly and rise slowly. That is, the market is lopsided in its action. This is due to a kind of gravity in the markets — no one wants to catch a falling knife. The measure of gravity is not a constant, like in Newtonian physics, but a measure of the speed of price movement. Just like in physics, where force equals mass times acceleration, in the markets, force is a function of the instrument, volatility and range. And, it is stronger going down than going up. That is, there appears to be a kind of market friction associated with accumulation, and a kind of market acceleration with distribution. In the same way that gurus of yoga and meditation will tell you to breathe in with the nose and out with the mouth, the market would appear to breath in with accumulation and out with a distribution.

From a trader perspective, distributions are lovely. Manipulation/traps are harder to set up in a falling market. What’s more, you can get in and out of the market quickly. It might take you 2 hours to make 100 points in a rising market, but only 2 minutes to make 100 points in a declining market. This isn’t always the case, but it occurs more often than not, especially when there’s a lot of market or geopolitical news like there’s been over the last four weeks.

Going back to the physics of trading, perhaps a longer, time-based series is better for catching rising movements and a shorter time-based series, or a series that is independent of time, is best for catching declining movements. That is, getting in and out of a long trending position should be done on longer dated time frames, whereas getting into and out of short positions should be done with greater precision, using a data series that is not dependent on time (range, tick, etc). For example, you can use a 5 minute chart to get in and out of a long position, but a 36 range chart to get in and out of a short position as we did with Strategy 44.

We’re also still working on the possibility that the holy grail of automated trade strategy could be opposite sides of the same coin. It could be that the holy grail is knowing when to flip any strategy based on market conditions, or it could be the same strategy based on complementary markets, i.e., gold and equities.

We’ve also got Strategy 46 coming up on April 1 and our first “Revised” Mudder Report coming up on April 3rd.

Answers to Some Commonly Asked Questions:

  • Perhaps one of the most commonly asked questions we get is, ‘how much do I need to get started?’ For more on what we think is the best way to approach this question for yourself, click here.
  • We continue to receive questions about funded trader programs. In particular, some of you are on the hunt for a strategy that will pass the funded trader programs out there. If that’s what you’re looking for, this is not the place for you (read: do not purchase a subscription if that’s what you’re looking for). That said, our most recent strategy (Strategy 45) uses a risk management strategy that slowly ramps up contracts. This is the kind of strategy you want to employ when attempting to get funded as well. Start small on an MNQ contract and then increase to NQ. For more on what we think about the best way to approach funded trader programs click here.
  • In general, one of the most common questions we get pertains to the use of our strategies on other assets like crypto. You can read more about that in the post: Do our strategies work on cryptocurrencies? We plan on updating this post, but this is one of the projects that’s been pushed. I hope to revisit this by the end of the summer.
  • Another commonly asked question is in regards to overfitting. You can read the following posts to learn more about overfitting and what we’ve done to reduce its impact: Overfitting: What is it and what can we do about it and What Are We Doing To Ensure Backtest Accuracy? A few months after writing these posts I received a question regarding strategy strength and what optimization tools we’re using to increase robustness. We answered that question in the post: How Can You Tell If An Automated Trading Strategy Will Perform Well Over Time?
  • Some subscribers have said that our strategies are too complex, while others have said that they lack complexity. To the former I say: we are here to help. Please reach out to me with your questions. To the latter I say: our aim is not complexity, it is a certain level of consistent performance based on the attributes listed above. That’s what these updates are all about. We’re all trying to figure out what works and what doesn’t over time. What we’ve found so far is that complexity is often unreliable. If you have any questions, please ask us or reach out. It might take a few days, but I try to respond to every email.
  • One common critique is that the strategies we give away (Strategies 1 and 5 ) don’t perform well. That’s why we’re giving them away. The goal is to show you how our process works.
  • One of the most commonly asked questions we get is: How do I learn how to create automated strategies for myself? My advice is to use the resources provided by Ninjatrader. Just go to their Youtube channel and sign up. It’s free and there are many videos to learn from.

If you have any questions, feel free to contact me directly at automatedtradingstrategies@substack.com

Subscribe now

Thursday, January 20, 2022

Automated Trading Strategies: January Portfolio Update: In 2021 Our Top Strategies Made Over $3.3M Based on NT8 Backtest Results

It’s been one year since we started this. With every update, the data grows richer and our insights more insightful.

We all want to believe there’s a way to measure the forward strength of a model, but the best you can do is make predictions about the future based on strategy performance and then track that performance, as well as the rationale for your predictions, over time. We use profit factor as the primary basis for that prediction, but there are a host of attributes we track in our search for the holy grail of automated trade strategy.

This is why we publish updates every two months to track the progress of strategies. We like to look at how our top automated trading strategies are performing and update you on our key findings, highlights, takeaways and what’s in the pipeline. The following post is our January update. You can view past updates here:

What Are We Looking For In These Updates

We are looking for one thing in particular: consistency. When we say consistency, we mean strategies that perform like the backtest, specifically with regard to profit factor. We are tracking our best strategies to find the best strategy attributes. We can then use these attributes to create a strategy that gets us closer to the holy grail of automated trade strategy.

We define the holy grail of trade strategy as having the following attributes:

  • Profit factor greater than 3
  • Annual drawdown less than 3%
  • Annual return greater than 500%
  • Maximum daily low of -$1,000
  • Avg Daily profit greater than $1,000
  • Less than 5,000 trades annually
  • Greater than 253 trades annually

For this update, we have an additional task. We need to cull the field a bit and this post will serve as documentation for that process. In total, we are sharing the performance statistics on 43 of our strategies. At the end of this post, our focus list will fall to 27 strategies. We will continue to update all 43 strategies every two months and you will continue to see some of them updated on a weekly basis in The Mudder Report, but only 27 strategies will make the final cut. The new list will serve as a way to focus our efforts, while the old list will serve as a reminder for how far we’ve come.

With that, let’s dive into the update.

November Vs. January

So where do we stand in comparison with our last update?

The table below provides the backtest results from our last update: 11/01/2020 - 11/01/2021

https://cdn.substack.com/image/fetch/f_auto,q_auto:good,fl_progressive:steep/https%3A%2F%2Fbucketeer-e05bbc84-baa3-437e-9518-adb32be77984.s3.amazonaws.com%2Fpublic%2Fimages%2Fbd7fb101-b088-4112-a95c-451b84ed864d_1304x751.png
Click to enlarge

For links to all strategies click here.

The following table provides the backtest results for the current or most recent update: 01/01/2021 - 11/01/2022

https://cdn.substack.com/image/fetch/f_auto,q_auto:good,fl_progressive:steep/https%3A%2F%2Fbucketeer-e05bbc84-baa3-437e-9518-adb32be77984.s3.amazonaws.com%2Fpublic%2Fimages%2Fb3f72c3f-96a1-419f-a1cd-35c5d9c05c36_1321x911.png
Click to enlarge

Strategies with less than 50 trades for the year were not included.

First, let’s review what the trend was coming into the January update.

  • In general, we had a deterioration from July to September. Profit per day decreased from $388 to $355 and profit per trade decreased from $145 to $116. Most of the deterioration occurred with optimized strategies. When we removed optimized strategies the metrics improved. What we’ve found over the year is that as much fun as optimized strategies are to ‘hunt’, they are more prone to overfitting and therefore have highly inconsistent results.

  • Moving into November, net profit for the total portfolio was basically flat, decreasing slightly from $2,788,075 to $2,746430, but the portfolio profit factor increased from 1.24 to 1.35 on fewer trades. Profit per day decreased from $355 to $304, but profit per trade increased from $116 to $230. Even though net profit decreased, it was a leaner and more efficient portfolio.

  • Moving into January, net profit for the total portfolio increased from $2,746430 to $3,314,996, and the portfolio profit factor increased from 1.50 to 1.54. In addition to a higher profit factor, we also have a slightly lower max drawdown percentage. Profit per day continued to decrease from $304 to $294 and profit per trade decreased slightly from $230 to $224.

We’ve been at this for a year, and we’re going to talk about more of our insights in the upcoming annual report, but what I’d like to do now is compare the January 2022 update with the May 2021 update. The May 2021 update is the first update we had where profit factor was used to track performance.

The following chart was from the May 2021 update:

The average profit factor was 1.07. The average profit factor for the same strategies after the January 2022 update was 1.11, which is fairly consistent. Still, only a few of our first 15 strategies offer the kind of performance we’re interested in continuing to research. Going forward, we’re going to focus our attention on Strategies: 3, 4, 7, 8, and 10. So that’s an overview of our first 15 strategies. Only 5 made the cut. Now, let’s look at how Strategies 23 through 36 performed.

Strategy 23 had a drop in profit factor from 1.21 to 1.08. Even though Strategy 23 continues to have one of the lowest draw-downs at 1.97%, we don’t like the inconsistency and we really don’t like the low net income. As a result, we will no longer be studying Strategy 23.

Strategy 24 had a profit factor of 1.62 on the last update, and a profit factor of 1.64 on the January update. This is the kind of consistency we’re looking for in a higher profit factor strategy. Profit per trade went down from $395 to $373 on fewer trades, and drawdown remains fairly high at 7.45%, but we’re going to continue to study it.

Strategy 25’s profit factor jumped from 1.12 in the November update to 1.25 in the January update, which is highly inconsistent. In addition, it has a low net profit and a high drawdown at 11.07%. We will not be studying this strategy going forward.

Strategy 26 is one of our most consistent strategies from a stats perspective, but 1.17 is still a low profit factor and it made only $18K for the year on a 12.41% drawdown. We will not be studying this strategy going forward.

Strategy 28 only made 81 trades from January 1, 2021 to January 2, 2022, but it maintains a consistently high profit factor at 1.58, down from 1.60 in the last update. We will continue to study Strategy 28 due to its profit factor, consistency and high profit per trade at $387, but the return on max drawdown is a concern at only 191%.

Strategy 29 performed poorly and has a high drawdown, so we will not be studying Strategy 29 going forward.

Strategy 30, coming in at only 116 trades for the year, is one of our best performers with a profit factor that increased from 2.09 to 2.33. This may seem inconsistent, but at this level of gross profitability all we wanted to see is a profit factor greater than 2.09, and we got it. Strategy 30 also has a relatively low drawdown at only 3.72%, a return on max drawdown of 717% and a net profit of $81K. We will definitely continue to study this strategy.

Strategies 31 and 32 are both marked by high volatility. Even though the return on max drawdown is only 300% for Strategy 31, we’re going to continue to study due to the high number of trades. Strategy 32 performed poorly. It was one of only two strategies that had a negative net profit in 2021. We will no longer be studying Strategy 32.

Strategy 33 has always been one of our favorite strategies. Strategies 34 and 35 are the same as Strategy 33, but they are use a different data series. The strategy tested well on other contracts like RTY and GC, so we decided to track all three (RTY, GC and NQ) on the performance chart. What does the most recent update tell us about Strategy 33?

  • The gold (GC) backtest was a disappointment, so we’re no longer going to study GC.
  • The RTY backtest showed a profit factor of 3.02, down from 3.29 in November. The inconsistency is worrisome, but 3.02 is still high. The only issue with this backtest is the low trade count at 76 trades on the year, but those 76 trades made $58K.
  • The NQ backtest saw an increased profit factor from 1.45 to 1.73 on 186 trades and $110K in net profit.
  • If we move to Strategy 34, we’re looking at the 1,000 tick data series for the same strategy. Both NQ and ES performed well with profit factor’s over 2.00.
  • Strategy 35 is the same as Strategy 33 and 34, but we used an odd data series on it — 669 ticks. This was a mistake made on the data pull, but the results were so good that it seemed almost irresponsible not to report. So, we included Strategy 35 as an ‘optimized strategy’ with an implied warning — in other words, we were very concerned with its consistency. Our concerns have been somewhat allayed because the profit factor for Strategy 35 increased from 2.21 on 155 trades to 2.84 on 118 trades. Net income increased from $150K to $162K for the year and return on max drawdown increased from 1177% to 1271%. We continue to be impressed by Strategy 33 and its ability to perform well using various instruments and data series.

Strategy 36 also performed well with a profit factor that increased from 2.11 to 2.66. While it only made 99 trades for the year, it has a low drawdown at 2.65% and a net profit of $77K. We will also continue to monitor Strategy 36.

Strategies 37 through 41a(H) were all published after the November update so we’re going to wait until the March 2022 update to assess.

Our New Target List

Our research list has gotten smaller, but strategy performance is improving over time, which is all we can ask for. From a holy grail perspective, we’re only going to focus on the following strategies:

https://cdn.substack.com/image/fetch/f_auto,q_auto:good,fl_progressive:steep/https%3A%2F%2Fbucketeer-e05bbc84-baa3-437e-9518-adb32be77984.s3.amazonaws.com%2Fpublic%2Fimages%2F42fb8295-33c6-47eb-9435-d9f169fb6240_1404x696.png

Doing this allows us to focus our efforts for future ATS Research.

We will continue to provide periodic updates on all strategies. We will also continue to track some of the strategies that have been removed from the list on a weekly level in the Mudder Report.

Update Summary

We started this journey down one road. As expected, that journey sent us in many directions. Today we are focused on three paths. There’s strong evidence to suggest that the holy grail of automated trade strategy might be at the end of one (or perhaps all) of these paths. Each path is focused on a different theory about the nature of the holy grail, which we believe is either all or one of the following:

  1. a static strategy
  2. a static strategy with a profit factor of 1 that flips based on certain market conditions
  3. a moving target made up of several strategies

My favorite theory is still #2, though it is proving to be the most difficult to study.

We’re also working on a theory that the holy grail of automated trade strategy might be a scalping strategy. We’ve already found a strategy with over 400 trades and a profit factor greater than 4, but the net profit, as can be expected, is small. The challenge with scalping strategies is making enough profit per trade to cover expenses, i.e. commissions.

The key to finding the holy grail for all three theories as outlined above is to document, narrow and refine. Our bi-monthly updates—like the one you are reading now—along with The Mudder Report and additional backtest research, are meant to share the process with you.

One thing is certain, we’re closer than we were last year and we couldn’t have done it without your support.

Answers to Some Commonly Asked Questions:

  • Perhaps one of the most commonly asked questions we get is, how much do I need to get started? This is hard to say because it depends on many things, but ultimately you want to set your simulated account to an amount that is equal to the max drawdown plus some amount to buffer for negative attributes like a low profit factor, high drawdown, commission, slippage, etc. For more on what we think is the best way to approach this question for yourself, click here.
  • We continue to receive questions about funded trader programs. In particular, some of you are on the hunt for a strategy that will pass the funded trader program. On our last update we told you not to subscribe if that’s what you’re looking for. That said, in the last month we did discover Strategy 41a(E). It is the strategy with the lowest drawdown at .89%, but it only made $21K in 2021. Based on the backtest, it will get you there, but it might take some time. For more on what we think about the best way to approach funded trader programs click here.
  • In general, one of the most common questions we get pertains to the use of our strategies on other assets like crypto. You can read more about that in the post: Do our strategies work on cryptocurrencies?
  • Another commonly asked question is in regards to overfitting. You can read the following posts to learn more about overfitting and what we’ve done to reduce its impact: Overfitting: What is it and what can we do about it and What Are We Doing To Ensure Backtest Accuracy? A few months later, we received a question regarding strategy strength and what optimization tools we’re using to increase robustness. We answered that question in the post: How Can You Tell If An Automated Trading Strategy Will Perform Well Over Time?
  • One of our subscribers told us that the strategies were too hard to understand. To this we say, “Ask us anything. We’re here to help.” Practice on Strategies 1 and 5 (both are free) first and then ask us if you have any questions. Also, unlike most websites, we give you a full description of the strategy so you can see and play around with the full mechanics of the strategy.
  • At least once a day I receive an email telling me that our free strategies (Strategies 1 and 5) aren’t any good. We agree, that’s why we’re giving them away. The goal is to show you how our process works. Many people think we’re just selling strategies, but that’s not the case, we’re on a hunt. We are all on the same hunt and we’re stepping up to take the lead as guide. We use our strategies as a way to raise money for some of the projects we’re trying to do related to the hunt, but our goal is to find the holy grail of automated trade strategy. When the two goals diverge we always steer toward the latter.
  • One of the most commonly asked questions we get is: How do I learn how to create automated strategies for myself? Our advice is to use the resources provided by Ninjatrader (we receive no remuneration for saying this). Just go to their Youtube channel and sign up. It’s free and there are many videos to learn from.
  • We recently received a question about rigged markets. In particular, he was worried about something referred to as front-running. I’ll be posting a response to this shortly. Hopefully it will debunk many of the myths around ‘rigged markets’. The truth is, what most people think of as rigged, traders have been working with for years. There is little room for regulation in free-markets. This isn’t health care, it’s literally “the market”. There are no nets, nor should there be. Unfair play is fair play.
  • Some of you have requested that we use the payoff ratio rather than profit factor to measure the strength of our strategies. We use profit factor to measure the strength of our strategies. Profit factor is calculated:

    Gross profit / Gross loss = Profit Factor


    Payoff ratio is calculated:


    Average winner / Average loser = Payoff Ratio


    We prefer profit factor because unlike the average win/loss ratio, also known as the payoff ratio, it tells us immediately if the strategy was profitable or not. The payoff ratio tells you about the average trade, while the profit factor tells you about the total strategy. In order to understand if the strategy was profitable in aggregate, you would need to multiply the payoff ratio by the % of profitable trades or the win rate. The ideal strategy is one that offers a high win rate and a high payoff ratio.

    • For the sake of the hunt, let’s create two scenarios to reinforce the difference between profit factor and payoff ratio:
      • Scenario #1: If you have a strategy with a payoff ratio of .92 and a win rate of 63%, it means on average your win/loss ratio is .92 so you’re losing money on every trade, but you win more than you lose, so you’re making a profit.

      • Scenario #2: If you have a strategy with a payoff ratio of 11.36 and a win rate of 12%, it means on average you make 11x more than you lose on each trade, but you only win 12% of your trades.

    • The holy grail of trade strategy might have a payoff ratio of 11.36 and a win rate of 63%. We have yet to find the holy grail of trade strategy, but the first scenario profiled above belongs to Strategy 40 and the second scenario belongs to Strategy 41.

What’s in the pipeline:

We’ve done a lot since the last update:

When we first started this project a year ago we only published 9 strategies. Last week, we published our 41st strategy and it met 5 out of 7 of criteria for the holy grail of automated trade strategy. So we’re close, but not there yet. Here’s what we have planned for 2022 to get us there:

  • Our first annual report will go out at the end of the month. It will include longer-dated backtests as well as a brief discussion of each strategy.
  • In the first six months of 2022, we plan on including backtests for:
    • additional futures contracts like CL, FDAX, YM and bonds

    • FX and cryptocurrency

    • single stock picks

  • We are looking into other platforms for our strategies as well as a few portfolio analysis options that might help to pull out additional insights for better strategy formulation. We’re also looking at testing other data feeds, which is quite expensive.
  • We’ve hired someone to start running our weekly selection for the Mudder Report on Collective2 for live/daily updates starting in March. Hopefully, we’ll have a process down by then. By the way, if you run one of our strategies on Collective2, let us know and we’ll pub it for you here. You can read more about Collective2 in the post:Question: Can I Use Your Strategies To Make Money On Collective2?
  • We’re also going to start publishing new strategies only on the 1st and 15th of the month starting in February. Some of you have asked for more consistency here and I think this will help to allay those concerns.
  • We are slowly making progress on our weekly update series — The Mudder Report. We’ve had some setbacks, but we’re learning a lot. Our goal is not to predict or recommend what to trade in the following week (it’s always fun to try your luck on a simulated account, but if you use the weekly update to trade live, you will get burned). Our goal in developing the Mudder Report is to aid in the development of a few working theories for the holy grail of automated trade strategy.

Finally, on January 21, we are transitioning to our new subscription format. To read more about the transition, click here.

If you have any questions, feel free to contact us directly at automatedtradingstrategies@substack.com or by responding directly to this post.

To view the original post, click here.

Thursday, January 13, 2022

How to select the best automated trade strategies for the upcoming week...

Oil painting (c. 1625) by Peter Paul Rubens of the goddess Thetis dipping her son Achilles in the River Styx. She dipped all of him but his heel. In the myths surrounding the Trojan war, Achilles was said to have died from a wound to his heel, which was his only vulnerability.


This is a follow up post for the weekly series dedicated to tracking our automated strategies at the weekly level. You can read the first post here. You can also click here for links to all weekly reports so far. The original post provides an overview of our approach/intent along with an explanation of the reporting structure. Just like our annual backtest updates that happen every two months, we’re looking for consistency here, but at a more granular level.

The goal of the series is two fold:

  • to compare against annual statistics

  • to develop a rubric for a weekly strategy selection process

The latter is based on the premise that the holy grail of automated trade strategy may not be static, but more fluid like a chameleon or rather made up of multiple strategies.

Monday, November 15, 2021

Automated Trading Strategies: November Update

In The Last 12 months Our Strategies Have Made Over $2.7M Based on Backtest Results

We all want to believe there’s a way to measure the forward strength of a model, but as we’ve explained before, market data is not random. It is based on auction mechanics. So, the same tools we use to validate and test the quality of data in a random data set can’t always be applied to the market. This is why we say ‘don’t use the simulated data feed within Ninjatrader’. It’s a random, internally generated market and has no correlation to real market data. So what can you do? The best you can do is make predictions about the future based on strategy performance and then track that performance, as well as the rationale for your predictions, over time.

Thursday, November 11, 2021

2022 Could Be One Of The Most Volatile Years In Recent History

Calm Before A Storm, Henry Moore, 1883

Last week we published the results from a backtest of all strategies on the E-Mini Russell 2000 (RTY). We then compared those results with the E-Mini NASDAQ 100 (NQ) backtest. There were some interesting observations that you can read more about here.

In that post we talked about the impact of volatility on trading profits. We also reviewed the definition of volatility:

“A measure of dispersion around the mean.”

…and, discussed what our next steps were in the process: namely to compare our backtest results with other assets. In particular, those assets that may be more volatile than indices, like commodities.