The current backtested portfolio made $5.2m from April 2022 to April 2023. The portfolio made $219/trade on 24K trades (94 trades/day), had a max drawdown of $1.3m and profit factor of 1.48.
In case you didn’t know, we’re on the hunt for the holy grail of automated trade strategy. I define the holy grail of trade strategy as having the following attributes:
- Profit factor (gross profit/gross loss) greater than 3
- Annual max drawdown less than 3%
- Annual return greater than 500%
- Maximum daily low of -$1,000
- Avg Daily profit greater than $1,000
- Less than 5,000 trades annually
- Greater than 253 trades annually
Every few months I like to look at how our top automated trading strategies are performing and update you on key findings, highlights, takeaways and what’s in the pipeline. I’ll be transitioning to quarterly updates going forward. This is the Q1 2023 update.
Important: There is no guarantee that our strategies will have the same performance in the future. We use backtests to compare historical strategy performance. Backtests are based on historical data, not real-time data so the results we share are hypothetical, not real. There are no guarantees that this performance will continue in the future. Trading futures is extremely risky. If you trade futures live, be prepared to lose your entire account. We recommend using our strategies in simulated trading until you/we find the holy grail of trade strategy.
The goal of this review is to update you on any progress made since the last update. You can view past updates below:
- January 2023 Update
- September 2022 Update
- July 2022 Update
- May 2022 Update
- March 2022 Update
- January 2022 Update
- November 2021 Update
- September 2021 Update
- July 2021 Update
- May 2021 Update
- March 2021 Update
First, I want to apologize for the delay in publishing this update. Ninjatrader platform changes required time to integrate/digest, but with the help of NT8 support (thank you Michaelanne and Zachery) I feel like we’re at the end of the trial and better for it.
Second, I want to highlight a comment I received earlier this month:
Thank you for your question Chris, and right you are, but don’t fool yourself. Even the live results come with a high degree of risk and anyone that doesn’t stress that the nature of this hunt is always high risk is doing you a disservice.
Furthermore, the cost of the annual subscription is far less than the average trader has lost. Let me put it another way, the “paid” version of The ATS Newsletter is meant to be a service for those that are already in the trenches of the hunt. They are looking for more strategy ideas and can’t seem to break out of a certain level of performance with their own backtests.
So, before subscribing to the paid version of ATS, I recommend reading all of our free content. Download our two free strategies (Strategies 1 & 5) from the Strategy Description Page. Try creating your own strategy variations from 1 & 5. I still use both of these strategies. In fact, both strategies made the cut for the April 2023 backtest. See if you can duplicate our results. Read through the FAQs. You can also try tapping into the Ninjatrader Ecoysystem for free information about strategy development. Check out trade strategy forums; build your own trading circle to bounce ideas off of. Develop your own theories, then document the process in a journal; review it often and then share key findings with others. I can testify that the process will make you a better trader and/or portfolio manager.
When we first started, I published 10 strategies that barely had a profit factor (gross profit/gross loss) greater than 1.05. Today, we have 66 strategies, and we only document those strategy variations with a minimum profit factor of 1.30. Click here for the Strategy Description Page.
When we first started, in a kind of mental masturbation, we optimized every parameter; today, after being impaled by a few over-fitted unicorns, we only optimize the time series.
When we first started, I thought the simulation had no limitations. Today, I know that using the simulation as a tool to find viable strategies must carry with it an understanding that accuracy holds an inverse relationship with complexity.
It’s the last point that’s the hardest to get your head around, because you have to bump into the limitations before you know they’re there.
We did a lot of bumping around in the beginning, but the bruises from those bumps have exposed a world of opportunity and that opportunity is in the form of viable strategies and their derivatives.
The current backtested portfolio made $5.2 million from April 2022 to April 2023. In total, the portfolio made just under 24K trades (~94 trades per day and ~$219 per trade), had a max drawdown of $1.3 million and profit factor of 1.48. Note the portfolio does not include strategies 63, 64, 65 or 66. Those will be added to the backtest portfolio on the next update.
The goal of the backtest is to find the strategies worthy of further testing. Let’s take a look at some of the top performing strategies in the backtest:
- Strategy 44b has the highest profit factor at 3.03. Unsurprisingly, it also boasts the highest win rate at 96%. Unfortunately, the profit is low at only $11K, but that can be increased by applying scale. In other words, $11K is the profitability for 1 contract; so you can estimate the impact of adding another contract by adding another $11K. One contract is $11K, two contracts is $22K, three contracts is $33K, and so on. Keep in mind that the more contracts you use, the higher slippage will be in either direction. This strategy is also performing well in forward tests.
- Strategy 41a also has a high profit factor at 2.08. Unfortunately, the win rate is very low at 5.13%. While profitability is much higher, the win rate is problematic, still the strategy has performed well in forward tests.
- Strategy 32 has a profit factor of 2.13. The win rate is only 52%, but profitability is $93K. Drawdown is also quite high, but it was worth further testing. I can say the same thing about Strategy 31, which is related to 32. Unfortunately, both strategies performed poorly in forward tests.
- Strategy 7, one of my favorite strategies, has a backtest win rate of only 52%, but a profit factor of 2.08 and a net profit of $76K. Strategy 7 is also performing well in the forward test.
This is a good time to get back to Chris’ question. What good are backtests without a forward test to test the accuracy of the backtest (you can read more about how to set up a forward test here)? It’s a good question, and I’m going to share some of those live results with you today. When I say live, I mean that we’re using live data on a simulated account. This is data that is typically only shared with paid subscribers via the Mudder Report.
The goal of the Mudder Report is to track our best backtested strategies based on real-time trade data. In other words, these are the results of the forward test. The trades are being made on a simulated account, so the results are still hypothetical, but the data driving the simulation is live. This is where we are after 14 weeks:
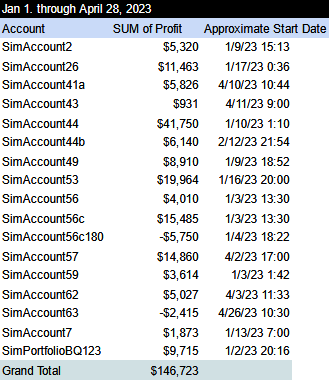
As you can see, not all strategies were started on the same day. Note, the SimAccount is connected to the Strategy #, so SimAccount13 is Strategy 13; SimAccount15 is Strategy 15, and so on. Also note that this list is not exhaustive. I select the highest performing strategies from the backtest to run in the forward test. Poor performers are removed, while new strategies are added.
Strategies 6, 13, 15, 29, 31, 32, 54, 60, Portfolio 2, and Portfolio AQ123 have been removed for poor performance. EMD & YM have also been removed. We will no longer backtest these instruments. Strategy 56c180 is on the chopping block, but we’ll be adding Strategy 65 to the forward test over the coming weeks.
Over the last four months ATS has published strategies: 60, 61, 62, 63, 64, 65 and 66. I’m looking forward to seeing forward results for Strategies 63, 64 and 65. All three boast win rates greater than 90%.
We will continue to add\develop strategies throughout the year as discovered through backtests. The goal is to use the backtest to find strategies to test in the forward test and then use the forward test to find a few true gems by year end.
In addition to single strategies, we’ve also been tracking several portfolios in real-time. Each portfolio was based on a different portfolio theory. You can read about the nature of each portfolio in previous Mudder Reports, but the only portfolio that prevailed is the one with the best overall win rate, not profit factor or net profitability. This is Portfolio BQ123, which is up almost $10K for the year.
Q2: Narrowing the Focus
In Q1, we optimized all strategies by data series and contract type to find the “best” performance. Several strategy lists were created to align the best instrument and data series with the best strategy to include:
Equity Futures:
- E-mini Nasdaq-100 (NQ)
- E-mini DOW (YM)
- E-mini Russell 2000 (RTY)
- E-mini S&P MidCap 400 (EMD)
- E-mini S&P 500 (ES)
Agricultural Futures:
- Cotton (CT)
- Coffee (KC)
- Soybean (ZS)
- Rough Rice (ZR)
- Wheat (ZW)
- Soybean Meal (ZM)
Metal Futures:
- E-mini Gold (QO)
- Gold (GC)
- Silver (SI)
- Copper (HG)
We also backtested a few of the better performing strategies on BTC futures and several stocks including: $LULU, $VRSK, $SPLK, $AAPL, $CTAS, $ORLY, and $TSLA. We also looked at energy, FX and interest rate futures in a limited way, and plan to revisit in the future (especially FX and rate), but in Q2, we’re going to take a slight detour. We’re going to narrow our focus on strategies with a high win rate. We’re also going to narrow our focus on a certain set of instruments that appear to perform better in the forward test than others. Specifically, NQ, HG, ES, RTY, MNQ, M2K, MES and FDAX. I’ll discuss why I think these instruments are testing better than others in the Mudder Report.
Inflation and Automated Trading
“Because of the lag between policy actions and their effects, it will take time for the FOMC’s actions to restore balance to the economy and return inflation to our 2 percent target. I expect inflation to decline to around 3–1/4 percent this year, before returning to our longer-run goal of 2 percent over the next two years.”
- This Is the Way, John C. Williams, chair of the Economic Club of New York, president and chief executive officer of the New York Fed, vice chair and a permanent voting member of the Federal Open Market Committee.
How can I wrap this up without a few words on the impact of inflation on our hunt.
Instead of This is the Way, the speech John C. Williams gave to the Economic Club of New York last week would have been more aptly titled, This is The Party Line. It’s the safe thing to say because everyone is saying it, but is it true?
Last week, the FOMC raised the target range for the federal funds rate from 5 to 5–1/4 percent, its tenth consecutive rate increase. It also said that it will continue to sell holdings of Treasuries and agencies. Twenty years ago, this kind of quick action would have brought the economy to a halt. Instead, what we have is a very contained credit crunch. The price patterns I’m seeing are highly unusual due to this containment, which is essentially heavy buying due to bank failures.
Still, there’s an almost Santa Claus like belief in the air. It is the belief that the tools of twenty years ago will somehow work today — “there’s just a lag, a delay”. I’ll be the first to go on record as calling bs on the party line. It’s not a delay, it’s a new price level.
Many traders make their money by waiting on the pull back. This happens after the price has a run up. The pull back should be at the same angle as the run up; that is, if the run up was particularly steep, the pull back will counter with an equal whip down before it continues up. If it goes sideways, it’s called a divergence, which is generally a sign of heavy buying in this situation. If it goes up, it’s a strong divergence, which is a sign of very heavy buying. The market has gone up over the last six months, not down. So what we’ve got is an artificially induced technical pullback with a strong divergence. In such a case, the price will surge once the pullback is complete.
In the beginning of 2022, I wrote about volatility and its impact on automated trading strategies. In particular, it increases the likelihood that backtest results will be misleading. It also increases your drawdown and therefore the amount you need to maintain in your account at all times to withstand it. More importantly, it increases the need for forward tests. But, it also increases your potential for higher profitability. It’s also good for any strategy that relies on volatility and/or is skewed positive, which I suspect is the case for any strategy that was backtested over the last five years.
We shall see if the “party line” holds or not. I suspect it will morph into something quite different over the next two years. Meanwhile, we’re going to use the next three months to:
- Go supernova on the win rate portfolio strategy — This strategy has proven itself in forward tests for two quarters in a row so we’re going to re-engineer all 60+ of our strategies to obtain the highest win rate by applying several techniques that have been shown to boost the win rate of any strategy. Then we’ll create a high win rate portfolio out of those strategies with the fewest defects (unprofitable trades).
- Forward test — Continue tracking the forward test performance of certain strategies and portfolio theories in real-time.
- Begin correlation studies — Nothing about trading is easy. Automated trading makes it easi er by providing a guidepost, but in the end, you are at the whim of an artificial intelligence that feeds on biological reactions that can never truly be rationalized and therefore predicted. So in addition to focusing on strategies with a high win rate, we’re hoping to explore an area of strategy development that I’ve seen very little of — we’ll be diving head first into an AI process that is said to mimic biological intelligence more so than traditional artificial intelligence by looking at a few correlations rather than a million iterations to learn relationships.
Needless to say, I’m really looking forward to Q2.
If you have any questions, comments or recommendations, please reach out by responding to this post or emailing at AutomatedTradingStrategies@protonmail.com.
Click here for strategy links. Click here for FAQs.
Automated Trading Strategies is a reader-supported publication. To receive new posts and support this work, consider becoming a free or paid subscriber.
We have no affiliation with any vendor mentioned or linked to in this post.
Originally published on May 12, 2023 at https://automatedtradingstrategies.substack.com.
I like to reward close readers by putting all promotions at the end: Click here for the current discount.
No comments:
Post a Comment