Internally, we are looking at two things in particular — alpha decay/consistency of published strategies — what can this tell us about the best strategy attributes and how can we use these attributes together to create a strategy that gets us closer to the holy grail of trade strategy. We define the holy grail of trade strategy as having the following attributes:
Profit factor greater than 3
Annual drawdown less than 3%
Annual return greater than 500%
Minimum daily net profit of -$1,000
Avg Daily profit greater than $1,000
Less than 5,000 trades annually
Greater than 500 trades annually
Notice that we’ve added another bullet — the strategy has to produce more than 500 trades per year. We’ve noticed that strategies that produce less tend to have inconsistent backtest results.
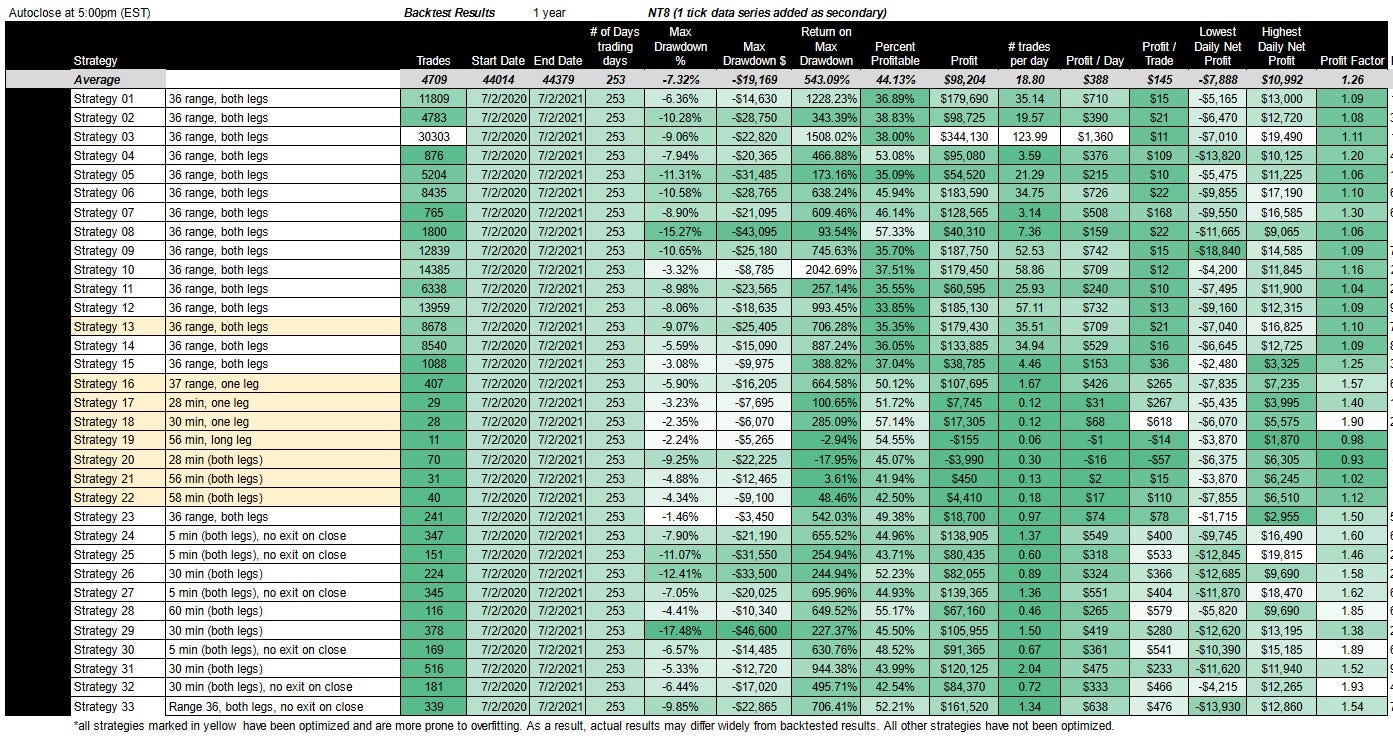
We’ve also added two columns to the end of the backtest table - cumulative low and cumulative high (see below). Instead of just looking at the lowest and highest daily net profit, we wanted to look at the cumulative high and low over the year. While this is highly dependent on when you start the strategy, when combined with profit factor and max drawdown, it can provide a compelling risk/reward profile.
For example, Strategy 28 has the lowest daily cumulative profit at $9,690, which means that even though the strategy had a max drawdown of $16,365, the total account value never dropped below $9,690 on a rolling or cumulative basis. Yes, this means that on day 1, the strategy made $9,690. Again, this has more to do with when the strategy is started than profitability, but it can make all the difference in the world, especially with a highly volatile strategy. This is the main reason we include profitability per day of week and hour of day in our strategy results. We’ll discuss this more later.
7/2/2020 - 7/2/2021 Vs. 8/30/2020 - 8/30/2021
So where do we stand in comparison with our last update? The table below provides the backtest results from our last update: 7/2/2020 - 7/2/2021
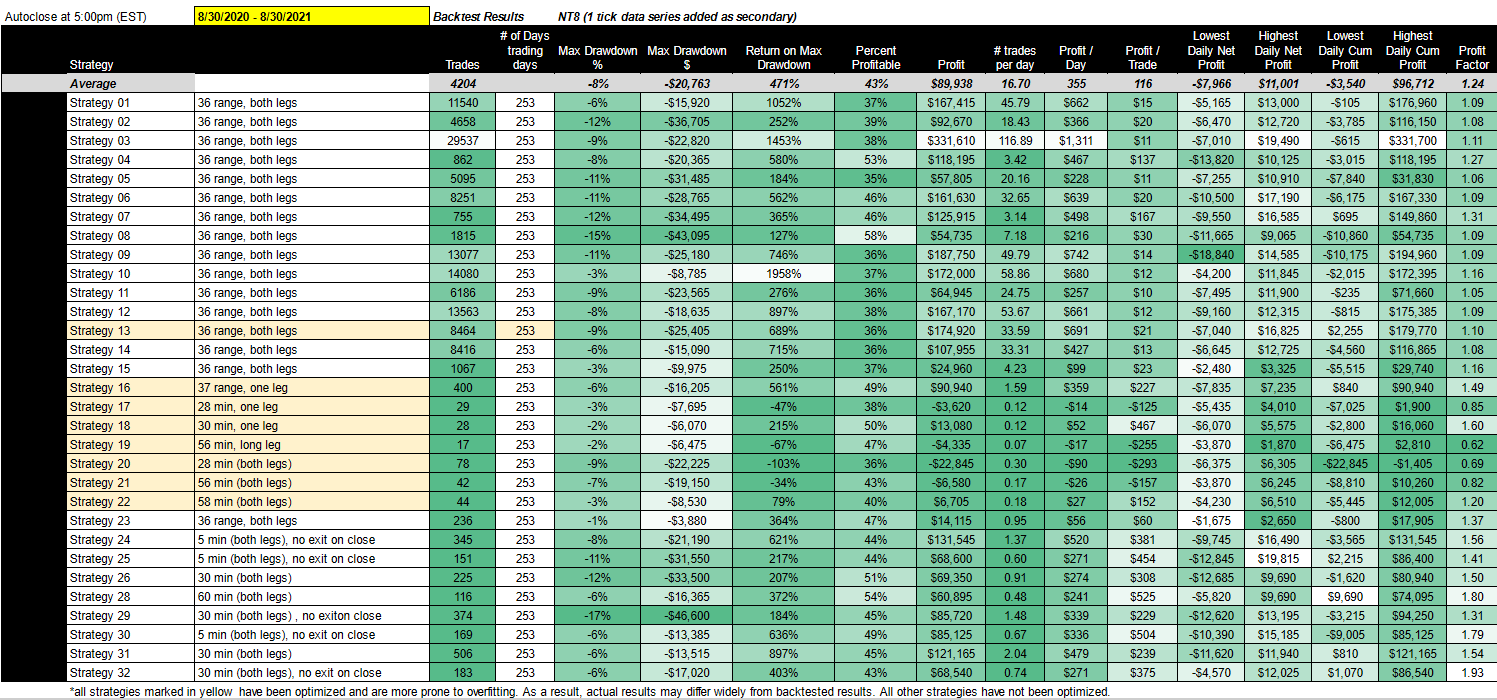
The following table provides the backtest results for the current or most recent update: 8/30/2020 - 8/30/2021
[Our apologies for the small font, but you can enlarge by clicking on the picture.]
In general, when comparing the performance of both time periods, we had the same drawdown as the last update and a slight decrease in the return on max drawdown due to a decline in profitability. Average profit factor for the entire portfolio decreased from 1.26 to 1.24 and average net profitability decreased from $98K to $89K. Profit per day decreased from $388 to $355 and profit per trade decreased from $145 to $116. The number of profitable trades also decreased slightly from 44% to 43%.
Most of the deterioration occurred with optimized strategies (marked in yellow on the chart). Optimized strategies are more prone to overfitting and therefore have highly inconsistent results.
So what happens if we remove all optimized strategies from the portfolio? The chart below provides a comparison with and without optimized strategies.
Profitability increased from $89K to $110K on average. Likewise, average profit factor increased from 1.24 to 1.30, profit per day increased from $355 to $436, and; profit per trade increased from $116 to $155.
What does this tell us? Optimized strategies do not work, at least using the methodology we’ve used in the past — almost all optimized strategies performed worse except for Strategy 22. It also tells us that our unoptimized strategies are performing well against the previous update. Strategies 4, 7, 8, 10, 11, 26 and 31 all performed better. Strategies 4 and 26 had the highest increase in profit factor.
For the year, net profit for the total portfolio increased from $2,223,095 to $2,788,075 with a total max drawdown of $643,640. Specifically, the model is telling us that a $643K investment could have made $2.8 million between 8/30/2020 - 8/30/2021. This amount does not include commissions. We advise a fixed price commission plan for strategies with more than 1 trade per day.
The biggest question, or the question you should be asking yourself, is how can I guarantee this will happen again next year? Unfortunately, the answer is you can’t and don’t believe anyone that says that you can. All we can do is track how these strategies perform over time. Specifically, we are looking for consistency over time, which is why we conduct an update every two months like the one you’re reading now. We continue to mine and isolate the attributes of our top performing strategies with consistent results. The goal is to take the best attributes from the best performing strategies to create the holy grail of trade strategy.
We recently published a post titled: Top 5 Strategies By Performance. It gives an overview of the top 5 strategies in each category. This is a summary of the post:
Strategy 3 has the highest net profitability at $331K.
Strategy 3 has the highest profit per day at $1,311.
Strategy 8 has the highest percent profitability at 58%.
Strategy 10 has the highest return on max draw at 1958%.
Strategy 23 is the only strategy with a drawdown of less than 1%
Strategy 23 has the lowest daily net profit at $1,675.
Strategy 25 has the highest daily net profit at $19K.
Strategy 25 has the highest daily cumulative profit at $331K.
Strategy 28 has the lowest daily cumulative profit at $9,690.
Strategy 28 has the highest profit per trade at $525/trade.
Strategy 32 has the highest profit factor at 1.93.
For links to all strategies click here.
Subscribers, click here for a link to a discussion on how we used these top strategies to mine for the specific attributes that make these our best strategies.
What’s in the pipeline:
Much is in the pipeline.
We recently published a post titled: Do our strategies work on cryptocurrencies? In general, one of the most common questions we get pertains to the use of our strategies on other assets like crypto, so we’re also going to publish backtest results for other asset classes, including stocks.
We’re also looking at various data series types outside of ‘range’ like minute, tick, volume and Renko. Subscribers can click here for the full post on our experience with Renko backtest results.
Another commonly asked question is in regards to overfitting. You can read the following posts to learn more about overfitting and what we’ve done to reduce its impact: Overfitting: What is it and what can we do about it and What Are We Doing To Ensure Backtest Accuracy? After writing these posts, we became interested in creating a strategy that optimizes in real time. That is, instead of optimizing a strategy in 1 year backtest results, and then using those results as a way to place parameters on the future, we can optimize a strategy as close to the event as possible. In this way, the optimization is still based on backtest results, but the data used in the backtest is based on a very short period of time. Theoretically, overfitting should be less of a problem the closer the optimization occurs to the event. We’ll be publishing information about this indicator shortly.
We’ll also be publishing a post looking at strategies that use divergence theory. We started this research with the post: Can We Maximize The Profit Factor By Focusing On Timing?
We also plan on publishing a follow up post on market structure. We received some great feedback on this post and we’re hoping to incorporate it into our regular analysis.
We continue to receive questions about the difference between Total Investment & Reinvestment: This is our answer: Reinvestment Vs Total Investment. In addition, we’ve just added cumulative net profit to our table as a key performance indicator. When used in conjunction with max drawdown and return on max drawdown, you can get a better understanding for how much you’ll need to invest/reinvest in a strategy. Some of our strategies have positive cumulative net profit, meaning that the account value never drops below 0. We take a deeper look at these strategies in the post: Top 5 Strategies By Performance Indicator.
There are several other posts in the works, but it would take too long to discuss them here. Some research has been delayed and some has been pushed up. If you have any questions about anything in particular, please reach out to us directly.