Dogecoin: DBeS2gHm79fHsxkYWTatbCYonxxc8fQn4M
Bitcoin: bc1qga4p8wxjvc8vx2l9p5y35ac7t0q0jqf8lmsf9y

Friday, June 25, 2021

Automated Trading Strategies: Overffitting -- What is it and what can we do about it

First, happy reconstitution day traders! This is often the heaviest trading volume day of the year and this year it’s happening today (June 25). Get ready for a wild ride this afternoon. Click here to read more about what reconstitution is and how it impacts trading.

Second, there’s a mechanical elephant in the room and it’s called “overfitting”.

We aren’t programmers, statisticians or mathematicians in any way. So, we have to translate many of these terms into something that makes sense to us from a trading perspective.

In a nutshell, the definition of overfitting is: Good performance on backtested data, bad performance on future data. Specifically, it’s when a strategy learns the “noise” that’s specific to the backtest period, but that noise does not apply to future data.

So, the question is: what is noise in trading and how do you know the difference between a strategy that has been “overfitted” to the backtest data, but won’t perform well in the future and a strategy that performs well in backtests as well as in the future?

This is what we’re hoping to answer with this post.

Trading is both art and science

An illustration from Jules Verne's novel "The Steam House" drawn by Léon Benett.

I could limit this discussion to what we’re doing to prevent overfitting, which I do below, but I think it’s also important to understand how it applies to trading.

This is not an easy topic to discuss, primarily because the market is dynamic — statistical tools are not a fan of dynamic. Likewise, any attempt to forecast the market requires both art and science. Overfitting may explain why simple models don’t work in the future, but it has limitations on models that are dynamic and influenced heavily by outside forces, also referred to as noise.

I was amazed by how much literature there is on the topic of overfitting. It is of particular interest to those in the simulation or machine learning space, which makes sense. These strategies can be viewed as bots or machines and the holy grail of trading strategy is a bot that has “learned” the market. To do this, the bot would have to “learn” how to treat noise. Is it good noise or bad noise? This is where the comparison breaks down. Eliminating the noise in trading is extremely difficult because the market is primarily a reaction to noise, but we may be able to discern the good noise from the bad.

What does this have to do with overfitting? Overfitting happens when a model learns the detail and noise in the historical data that negatively impacts the performance of the model on new data. We know that we can optimize a strategy that then performs poorly in the future, but does it perform poorly because it learned the noise or because the noise is unlearnable? The only thing that’s truly learnable is the ability to identify the ideal conditions for a strategy to operate in. In other words, we’re looking for a strategy that knows when to trade. We can’t control the market, but we can control when the strategy takes action. The result is a strategy with fewer false flags (carving out the gross loss) and a higher profit factor.

So on one hand we can use the concept of overfitting to understand why a strategy does not perform well in the future, but on the other hand we must admit that the concept has limits for something as dynamic as market structure. It is almost impossible to not engage in overfitting when developing strategies, but there are things we can do to minimize it.

What can we do?

I want to go back to the original question. How are we making sure that our strategies aren’t the product of overfitting and will continue to do well in the future?

  • Optimize on hyperparameters one at a time - When we make changes to a strategy we make them one at a time rather than optimizing several variables at the same time. This gives us an opportunity to isolate the benefit of each change to net profit and profit factor.

  • Change the conditions of the strategy, not the hyperparameters: We don’t just want to create the machine, we want to change the surroundings or the environment of the machine. We want to create resistance to overfitting within the strategy itself. Put yet another way, we want to create the machine and define the conditional path it takes within the strategy. By doing so, we aren’t as concerned with the hyperparameters as we are the conditions of the strategy. For example, we aren’t as concerned with optimizing the hyperparameters of MACD (slow parameter, smooth, and fast) as much as we are with creating a condition that triggers an action (MACD cross when volume is higher than 3000). The trader can then update the volume accordingly rather than the hyperparameters of MACD. Volume sets the condition. In this way, the holy grail could be a moving target.

  • Focus on scenarios rather than sensitivity - This piggybacks on the above. We’re more interested in creating an environment within the strategy. This environment is like a scenario (mid day, low volatility, low volume) rather than a single variable. So, while we optimize based on one variable at a time, the conditions within the strategy are based on a scenario.

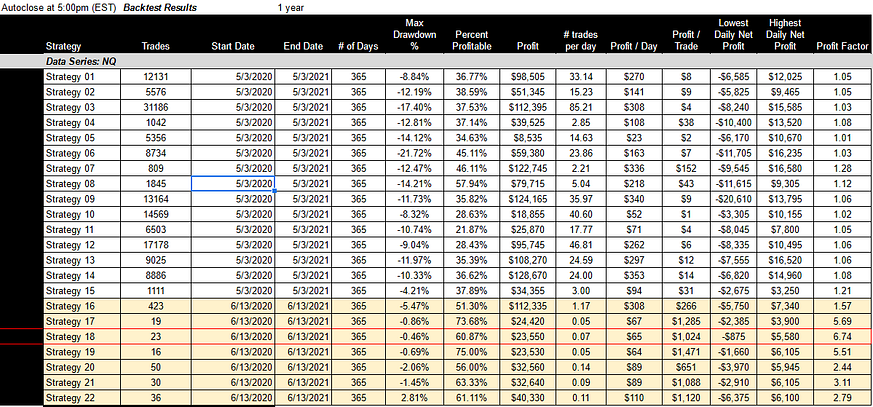
  • Use two sets of data in the backtest: Going forward, in addition to doing what we’re doing now, we’d like to use two sets of historical data, one to optimize on and one to test on, both are part of historical data. We’re thinking of using 3 months of validation data for the test along with a 3 month break. So that’s 18 months altogether. We’ll use the first 15 months in the backtest, followed by a 3 month break and then use the next 3 months as a test in two different data charts. This format may change, but this is the current plan.

  • Use Gross Loss/Profit in the calculation of Profit Factor - We use gross loss and profit rather than a variant that uses average loss and profit when calculating profit factor. The average ratio may smooth out the impact of big winners and losers, but that seems to lend itself to overfitting, especially since this is one of the primary performance measures we track and optimize on.

  • Use more than one instrument in backtest data - As a final check, we’re going to start running strategies through other instruments such as ES, GC, BTC, YM and stocks.

We’re hoping that these actions will help to ensure we’re picking up the “good” noise and not the noise that’s specific to a particular day or time frame when optimizing on backtests. That said, some of our strategies have no optimization at all and our focus is still heavily concentrated on NQ for its volatility.

Conclusion

I believe the market is full of both random and definitive events. Some things you do every day, some things are random (you know you eat lunch at around 12pm, but you don’t know what you’re going to eat). Like a simulation, everything is interconnected and random in the market and yet if you span out far enough some predictions can be made. It is this fractal nature of trading that makes it so interesting. The conundrum in trading is that the further you span out (i.e. increase the time series) the more susceptible you are to risk; the more predictable the market is, the more risk your trades carry. The predictable part of trading is the science (indicators, etc) and the unpredictable part is called noise. Indicators act different based on the noise. For example, most indicators are highly predictable in a rally, which is why traders love a good rally. So perhaps the best course of action is to create a strategy that is only triggered during a rally. This is much easier said than done, but just saying it gets us closer to the goal.

Trading is both art and science. Some of the most seminal papers in economic theory use formulas filled with assumptions that don’t make any sense (i.e., symmetry of information — an investor will never have access to the same information that a corporation would and investors will rarely behave rationally). These assumptions hold no relevance now, but they were used as a way to create a science out of economic theory and that science has little real world application. So it’s important to use statistics to track and measure progress and performance, but it’s also important to realize that statistical tools have a limit. Newton had to create the mathematical form we call calculus to express the laws of physics. Likewise, it could be that forecasting market structure requires a completely different way of thinking about “learning”, especially when the prevailing analytical framework dismisses relevant data as noise. As a result, data scientists are quick to blame poor performance on noise, but if we’re looking for a mathematical formula that can predict the true nature of the market it must include the noise. It isn’t that thinking about the market from a statistical perspective is bad, but it can limit our visibility and therefore our ability to find the holy grail of trade strategy if we get too attached.

Ultimately, while there are several key takeaways from this discussion, the main one is that not all noise in trading is bad. The key to discerning the good from the bad isn’t about changing the actions of the strategy, but the environment that those actions are taken in. And, we’re finding that those strategies that control the good noise through conditional equations and data series calculation (minute, range, tick, etc) seem to do better in the future.

What’s In The Pipeline?

There’s a lot in the pipeline, but we’re prioritizing something rather big right now. We’ve been impaled by a unicorn in the past, so we’re doing some due diligence before sharing, but the preliminary results are phenomenal. We want to say thank you to Pierre, one of our subscribers, for making a research request that has the potential to improve all of our strategies. Again, we’re compiling the data now and will share as soon as we feel it’s been properly vetted.

Happy trading!

To read more about our Automated Trading Strategies click here.

To subscribe to the Automated Trading Strategies newsletter click here

(this was originally posted on Automated Trading Strategies)

Monday, June 21, 2021

Automated Trading Strategies: Futures Trading Is A Dark And Scary Forest


Gustave Doré’s illustration to Orlando Furioso: a knight and his men see a knight and lady approach in the forest

I recently wrote a post titled: We Are Treasure Hunters Searching For The Holy Grail Of Automated Trade Strategy. I asked readers to “join us in the hunt for the holy grail in the dark and scary forest”. Moments later I received an email from a subscriber that seemed distressed. He was upset because he felt we were encouraging people to invest in automated trading strategies that were based on simulated data. He didn’t feel our assumptions were correct and seemed to question our motives. So I want to use this post to be clear about our goals. I also want to tell you a bit more about my personal background and what we envision for this newsletter.

Our goal:

We are hunting for the “holy grail of trade strategy” and we define that strategy as having the following performance:

  • Profit factor: greater than 3
  • Annual draw-down: less than 3%
  • Annual return (Return on Max Drawdown): greater than 500%
  • Minimum daily net profit: -$1,000
  • Avg Daily profit: greater than $1,000
  • # of Trades: less than 5,000 trades annually

Where do we stand today?

We have 22 strategies listed so far per the chart below and we try to post at least one strategy per month. 

We haven’t found the holy grail yet, but we’re getting close:

As you can see Strategy 18 is our rising star. It has 5 out of 6 of our criteria and a profit factor of 6.74, which means that it made 674% more in gross profit than gross loss last year. (members click here for a description of Strategy 18)

This is one of the primary objectives of Automated Trading Strategies: to find the holy grail of trade strategy. Our subscription fuels that research and we share all trade strategies that come out of this research with our members. To be clear: our paid subscription is specifically for those that want to share in the product of our research.

You don’t need to invest real dollars in our strategies to join the hunt

We want to encourage people to join us on the hunt for the holy grail of trade strategy. That said, and this is very important, you don’t need to invest real dollars in our strategies to join the hunt. You don’t even have to subscribe to our newsletter to join the hunt. 

We are targeting three groups of people with this newsletter:

  • Novice or New trader — Someone interested in trading
  • Seasoned Trader — Seasoned trader looking for an edge in a new strategy; automated or not
  • Automated Trading Strategy Hunter — Looking for high performing automated trading strategies and research specifically aimed at increasing the performance of trading strategies in general.

Within these groups, there are those that want to use our strategies live and there are those that don’t.

This section is a must read for those that want to use our strategies live.

We welcome and encourage all three groups to use our strategies, but it is important to keep the following things in mind, especially before going live. We are speaking to the novice or new trader, the seasoned trader and the automated trading strategy hunter:

  1. If you can’t afford to lose your full investment, don’t trade — not just our strategies, but in general. Automated trading is specifically for people that can afford to lose the full investment. At a minimum you’re going to need the annual draw-down on net profitability to get started. In other words, if you lose this money, it’s not going to result in a change in lifestyle. I have followers that are constantly on the lookout for alpha. Their threshold is low due to low/negative rates on fixed income products. These are the same people that drop $25,000 on doge and then sell it when the price pops to clear $4 million. I personally gave away over 50,000 doge on Medium (when it was trading for $.0000005) so this is a real phenomenon.
  2. Don’t ever go live on any strategy (ours or anyone else’s) without testing it first. We’re giving you a map, but you need to vet it out. Go on the trail yourself, GoogleMap it, think about how much food/drink you’ll need along the way, what kind of supplies — develop a game plan. Even then, the weather (market) may change on the day of the planned hunt, so nothing is guaranteed (more on this later).
  3. There are trading costs that are not included in our published stats, i.e. broker commissions, data costs, slippage, platform costs, research, internet, equipment, taxes. These costs depend on the trader/asset so you should think about what the cost of each is to you and what impact that has on net income. This is why you want a strategy with a profit factor (ratio of gross profit over gross loss) greater than 1. This is also why we report net profit per trade — all of these costs can be calculated at the per trade level. 

I’ve said this before, but it makes sense to repeat myself here, we are day traders, not coders or financial engineers. We’re a bunch of old day traders with little technological experience. We like to drink and talk about the markets on Friday afternoon. I don’t personally trade any of our strategies with real dollars, only simulated live. As a day trader, I make 1–2 live trades per day with a 3/5 to 1 risk reward ratio. And, I’ll continue this until I find an automated strategy that offers the same risk profile. 

Trading is hard

One common question we get is, ‘if I don’t know how to trade, can I still trade your strategies?’ Before I tell you the answer, I want to tell you about one of my favorite shows — Alone. 

Alone is a reality TV show about a group of people that compete to see who can survive in the wilderness alone for the longest period of time. The winner gets $1 million. It always amazes me when contestants show up on Day 1 with absolutely no knowledge of basic survival skills. But every season there’s the idiot that could barely make it past one night. There’s also the guy/gal that hunts for a living, studies bush-craft, is a religious fan of the show and has already developed a daily game plan based on the success of winners in past seasons. Rarely is his/her motivation about money; it’s about the psychological challenge, the love of the hunt.

Trading is the same way. It’s hard and you have to be prepared. You have to love the markets. You have to submit to the trend and create a game plan for defeating the dragon (your ego). It isn’t about the money; it’s about the psychological challenge, the love of the hunt and a fascination with market structure. So I would say using our strategies to trade if you don’t know how to trade is only preparing yourself to be eaten. Otherwise, you’re the idiot that signed up for a survival show that doesn’t know how to survive.

And, what’s nice about trading is that if you’re good, the market will provide — there’s no need to sign up for a contest.

Love at first sight

Personally, I’m in love with trading — I’ve been hooked ever since we first met. I try to convert friends and family, especially those with with kids and grand kids (simulated trading is basically a video game and kids love video games). Once you start making money in a simulated environment there are several companies that will fund you after passing a test — just do a search for funded trader programs

While trading in a simulated environment is akin to playing video games (you haven’t really risked anything but time), it can help to hone your skill-set to a point that you go on autopilot when trading live. It takes a lot of practice to learn something at the subconscious level. Indeed, it is said that it takes 10,000 hours of trading to make money.

As a day trader myself, I can attest to the hours required to learn how to trade. I’ve been trading for many years. I started as an associate working for a major investment bank. My job was to get prices for exotic currencies with no market so it was more about relationships than market knowledge. 

I worked on the bank’s trading floor. This was when institutional traders played poker and drank beer at lunch; they kept a 25 year-old bottle of Glenfarclas under the desk and a bottle of 222s in the drawer. They were the wildest people in the bank and they always got free stuff from brokers. One weekend a broker sponsored a “trader’s only” weekend at the Ritz. I had the time of my life. 

We all wanted to be the head trader. Bank leaders loved them. Risk managers feared them. They were unfettered, unruly, untouchable and I wanted nothing more than to be one of them.

I was a junior trader on the FX desk at the time. I didn’t know it, but I had one of the best mentors in the business. Back then, we had a squawk box that connected us to other traders, but sites like Oanda.com were just getting off the ground and traders were just starting to realize the implications that came along with financial technology. This was about the same time that banks started bringing in quant savants and financial engineers to create automated strategies. Traders knew that everything was about to change. And it did. Some traders stepped out on their own and lost it all. Some made fortunes.

What did I do?

This is my story

I opened an account with $10,000 and lost it all in nine days. I had no one to complain to, no one to blame. I could have blamed my mentor for laughing at me when it happened, but that’s what he was supposed to do. I was the only one to blame.

$10,000 was a lot of money for me in those days. I entered into a deep depression. Within days of entering the dark and scary forest I’d been eaten. A feral dragon came out of nowhere and devoured me head first. I tried to get away, but there was no reasoning with the creature — I was standing in some sort of emotional quicksand. (It seems obvious now, but I was the dragon)

This is when I decided to do two things:

  1. Develop an impenetrable risk management plan for day trades
  2. Create automated trading strategies

I needed something that would take the emotion out of trading. I needed something that would help me to slay the dragon — better yet, I needed something that would help me to avoid the dragon altogether. And so I began my own little hero’s journey. I haven’t stopped. Along the way, I found others. There are many others.

We’ve all been eaten.

We’ve all sacrificed.

We’ve all suffered.

So I understand when traders, especially those with experience, get mad when they feel as though other traders aren’t explaining the risks of trading to newbies with adequacy. Some traders are just selfish and want to keep the profession to themselves, but others are genuinely concerned. When we bring people into the dark and scary forest they can get eaten and we don’t want to be responsible for that. That said, for some hardheaded idiots (like myself) being eaten is part of the initiation.

The goal of any legitimate mentor isn’t really to teach you how to trade, it’s to teach you how to minimize the risk of being eaten. The more analytical you are, the harder it is to slay the dragon. Good teachers measure their success by the number of students that are still alive at the end of the day. While there are no guarantees, there will always be another trading day. So, the first question you need to ask your mentor is: What’s your risk management plan?

There are no guarantees

There is no guarantee that any strategy (simulated or live) will produce the same result in the future. We know and believe this. But, we also believe our requirements for the holy grail of trade strategy will point us toward a strategy with a true edge in the market. Furthermore, we believe that edge will be large enough to make up for any deviation that’s not modeled out in the simulation.

What’s Next:

  1. All Subscribers: Next Strategy Update/Review coming up on July 6
  2. Members: We are currently focusing on strategies involving pattern recognition. We would like to combine pattern recognition with reversion to the mean theory (Strategies 16–22 in particular) to see if an opportunity exists to increase net profitability.
  3. On 7/8/2021 our subscription price will be going up. You can read more about that here.
  4. Research Requests For Members: Thanks again for all the great questions and our apologies on the delayed response for some. Current research requests include:
  • Do our strategies work on cryptocurrencies (this is a common question)?
  • Are certain trading days better for automated strategies (earnings season, economic data releases, FOMC announcements, triple witching hour). If so, can we take advantage of these days in the future? 
  • What can market physics/auction mechanics tell us about trading strategy?
  • Can we develop a strategy that does better in the lunchtime lull?
  • Can we develop a strategy that does better during morning volatility?
  • Can we combine lunchtime lull and and morning volatility strategies into one?

If you have any questions, please reach out to us directly at automatedtradingstrategies@substack.com.

Subscribe now

To read more of our posts on Automated Trading Strategies click here.

Thursday, June 3, 2021

Automated Trading Strategies: Reinvestment Vs Total Investment

We (Automated Trading Strategies) recently received a question from a subscriber regarding total investment. He wanted to know how much a trader had to invest in each strategy (see a description of all strategies here), not just net profit. 

In other words, if we find a strategy that makes $100K a year, how much did it take to make $100K in one year? Did it take $50K or did it take $1 million? Due to the nature of futures trading, the answer can be both. We’re going to take a few minutes to explain why that is in this post.

Reinvestment Vs Total Investment

Any good automated or algorithmic trade is going to move like the market, which tends to ebb and flow. Very rarely is the market direct in its path to a particular point of support or resistance. So it is not unusual, especially for automated trades that use indicators as a trigger to buy and sell, to have high reinvestment.

Some traders view reinvestment cost as the cost of doing business, it’s almost impossible for a day trader not to. You use your account size, which for me is only 2% of $50K on any given day, to make more profitable trades than unprofitable trades. If you make $200, that’s great. $200 is your net profit, between your gross loss and your gross profit, but this doesn’t tell you how many trades it took to get there. It could have taken 11 trades with a gross loss of $1,000 and a gross profit of $1,200. So you lost $200 on 5 trades and made $200 on 6 trades, which put you up $200 on the day. Your gross loss is $1,000 and your gross profit is $1,200 —  net / net you made $200 on the day.

One way that traders measure reinvestment is with the profit factor. Profit factor is the ratio of gross loss and gross profit. Going back to our example, if you’re up $200 after losing $1,000 and making $1,200, the profit factor is 1.2 (1,200 / 1,000). So your breakeven is 1 or $1,000.

Let’s kick it up a notch

What if you made $200,000 for the year off of a gross profit of $2,200,000 and a gross loss of $2,000,000. Net/net, you’re up $200,000 for the year. Does this mean you have to have a $2,000,000 account to trade? Not at all. Gross profit and gross loss are like the notional rather than actual market value of your trades. It’s important, but not nearly as important as the incremental wins/losses.

That’s why we use draw-down as a measure of the % of cumulative profit that has to be used in the reinvestment rather than the % of the account size or gross p/l. So when we say that the draw-down is 20%, using our example, it means we had to give back as much as $40,000 of the $200,000 cumulative profit made over the last year. The higher the draw-down, the higher the capital requirement.

We prefer to measure capital requirement in this way because it takes daily reinvestment into consideration.

So it’s not wrong to focus on net profit rather than gross profit/loss. Indeed, a good automated trade strategy has its eye on both.

The Holy Grail of Trade Strategy

As a quick reminder, our goal is to find the holy grail of automated trade strategy and we think we can find it faster together.

We’ve defined the holy grail of trade strategy to be the following (based on annual performance):

  • Profit factor greater than 3
  • Annual draw-down less than 3%
  • Annual return greater than 500%
  • Minimum daily net profit of -$1,000
  • Avg Daily profit greater than $1,000
  • Less than 5,000 trades annually

We have yet to find this illusive trade strategy, but we’re on the hunt!

If you subscribe to our newsletter, you’ll be among the first to find out when we do.

Subscribe now

Note that we’ve included a requirement for a profit factor of 3.

We believe automated strategies with a profit factor of 3 and higher weed out strategies that aren’t efficient. It’s like an ROA (return on assets) of sorts. Investors like Warren Buffet look for high ROA investments because they make more money per dollar of invested assets. Rather than simply comparing earnings to the number of shares outstanding, or price to earnings, Buffet compares price to the dollar value of assets used to get you to that price. Put another way, instead of looking at earnings potential, Buffet looks at asset potential -- does the price of the investment correlate with the underlying investment in assets. Likewise, we are looking for strategies that create 3x more gross profit than loss.

The end result is an optimization of profitability -- automated strategies that stand the test of time.

The Key To Maximizing Profit Factor

So what is the key to maximizing profit factor?

Answer: Minimizing gross loss.

Based on the work we’ve done so far, the key to minimizing gross loss is to decouple complementary trades. In other words, just because you go long on an upward cross, doesn’t mean you have to go short on a downward cross. You can go long and then exit the long. And/or, you can short and then exit the short. Then you can put a strict conditional around each leg. In other words, you can isolate the profitable trades within the strategy. We found that this greatly increases the profit factor.

Tuesday, June 1, 2021

Automated Trading Strategies: Can We Maximize The Profit Factor By Focusing On Timing?

This is the first of a series of posts based on research requests submitted by subscribers of Automated Trading Strategies. Our goal is to find the holy grail of automated trading strategies.

We’ve defined the holy grail of trade strategy to be the following (based on annual performance):

  • Profit factor greater than 3

  • Annual drawdown less than 3%

  • Annual return greater than 500%

  • Minimum daily net profit of -$1,000

  • Avg Daily profit greater than $1,000

  • Less than 5,000 trades annually

We have yet to find this illusive trade strategy, but we’re on the hunt! If you subscribe to our newsletter, you’ll be among the first to find out when we do.

While we share our answer with all subscribers, only paid subscribers can request research.

This subscriber wanted to know what the impact of optimizing strategies based on time period would be.

Before answering this question, I want to explain how we compare results with the chart below. I also want to explain what the Profit Factor (last column) is.

Profit Factor

Here’s a chart showing the performance of our strategies over the past year.

For a description of each strategy click here.

Please pay close attention to the profit factor in the last column. This is our primary performance indicator. One of the main goals of this publication is to find a strategy with an annual profit factor greater than 3. We refer to it as the holy grail of trade strategy.

Profit factor is a function of gross profit and loss. It is the ratio of the two. So when gross loss equals gross profit we have a profit factor of 1.

One thing we’ve learned after running hundreds of strategies through simulation is that most strategies trend toward a profit factor of 1. In a nutshell, this is because the markets tend to revert to a mean.

Intuitively, it isn’t surprising to learn that when strategies are linked together by an indicator, they tend to have a gross loss and a gross profit that are remarkably similar over a 365 day period. So then the question is:

Is it possible to identify, isolate and reverse portions of gross loss. If we can’t reverse the loss, maybe we can just eliminate the bad trade altogether. This brings us back to time.

What Does Profit Factor Have To Do With Timing?

Timing is an aspect of the trade that we can isolate. We can find the hours of the day, in general, that the trade is most successful and only trade those hours. We can even optimize just one leg of the trade.

So, we optimized all our strategies and this is what we found:

In general, the profit factor (gross profit / gross loss) increased by 15-25% when we optimized the strategy based on the strategy’s most profitable trading hours.

The impact was particularly high for the long leg of the trade.

To be clear, reducing the time period reduces net profit, but increases gross profit compared to gross loss. The end result is a strategy that is more efficient and reliable allowing you to increase your contract size over time.

What’s Next

Now that we know that timing can increase the profit factor by 15% to 20%, we want to continue our research by researching reversion to the mean theories.

Specifically, we want to know:

  • If profit margin on all strategies tends to trend toward 0 or a profit factor of 1, is there a way to capitalize on this truth?

  • Is it possible to achieve a higher profit factor using strategies based on reversion to the mean theory?

As an example, we are currently looking at implementing mean reversion indicators like Bollinger Bands into our automated trade strategy and will share those strategies with subscribers of Automated Trading Strategies when complete.