Last week we published the results from a backtest of all strategies on the E-Mini Russell 2000 (RTY). We then compared those results with the E-Mini NASDAQ 100 (NQ) backtest. There were some interesting observations that you can read more about here.
In that post we talked about the impact of volatility on trading profits. We also reviewed the definition of volatility:
“A measure of dispersion around the mean.”
…and, discussed what our next steps were in the process: namely to compare our backtest results with other assets. In particular, those assets that may be more volatile than indices, like commodities.
Why are we doing this? Of course we’re curious about how well our strategies perform across multiple asset classes, but we also think 2022 is going to be one of the most volatile years in recent history. In general, higher volatility leads to better trading opportunities. And, we believe that volatility will be driven by inflation.
Why does inflation matter? Higher inflation or inflation volatility drives overall volatility in the markets, especially the commodity and currency markets. Since volatility is a trader’s best friend and we’re in the process of trying to find the holy grail of automated trade strategy (both moving target and static), it’s important to know how inflation will impact the markets. At the very least, we need to make an informed guess.
The good news (at least for traders) is that we believe 2022 will be one of the most volatile years in recent history and we are not prone to hyperbole. If this is the case, we want to make sure we’re looking at all options because there are assets that are even more volatile in price than the NQ and RTY. We are referring to commodities.
Inflation is Here
Unless you’ve been under a rock, you know that inflation is here. Prices for underlying inputs have gone up all over the world and those underlying inputs are commodities, quite literally. What does this mean? It means prices are going up because the value of the currency in which that asset is expressed in is going down. This spells trouble for all major currencies (this is a global issue), but assets that derive their value from something other than the backing of a central government will go up in both price and value. These are the assets you want to own.
Everyone has a different opinion as to why prices are rising. Some say it’s due to supply chain bottlenecks. Others say it’s due to enormous pandemic-related stimulus programs conducted by central banks. Still others say it’s the historically accommodative amounts of liquidity (cash) and historically easy financial conditions (rates near 0%), but we can all agree on the end result because it’s staring us in the face: inflation. Inflation is here and it’s not going anywhere.
As central banks print cash, managers are looking for a place to park it, which is pushing markets up even higher, especially those markets used to hedge risk. In other words, the premium on insurance (futures contracts) is going up.
While there may not be a consensus by the Fed on when it will start raising rates, the market is assuming at least three rate hikes before the end of 2023. And, while Jay Powell, US Fed chair, doesn’t want to link the start of tapering asset/bond buying programs with the onset of higher policy rates, we know they will be overlapping events. There are reports that show the Fed parring off its Treasury bond buys by $10 billion and its mortgage-backed security purchases by $5 billion each month beginning as soon as the middle of November.
The buyback scheme was put in place to address ‘dysfunctional trading conditions’ in the bond market during one of the sharpest contractions in history, but who’s to say that tapering the program won’t create another run on liquidity. If it does, the Fed will only be compelled to hasten its plans to raise rates in the face of increasingly higher inflation. As it stands, investors are challenging the view that the market is ready to stand on its own two feet. When you mix that with continued supply chain bottlenecks, which the Fed has already admitted has caught them off guard, it makes for fun times in the world of trading. This is especially true for commodities, which always increase with inflation and make equity indices have the appearance of treading water.
We are at the beginning of a perfect storm. And, it all makes sense because we are on the heels of what some would say has become a biblical event — the global pandemic.
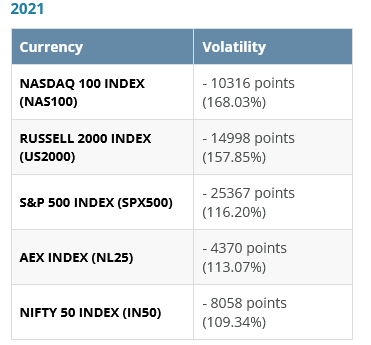
The chart below provides an overview of the most volatile equity indices.
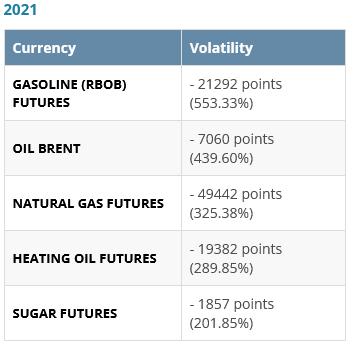
Compare this with the chart for commodities:
We are currently working on backtest results for some of these markets and will share them with subscribers first. This series will take some time to complete and we’re going to drop one backtest at a time based on each strategy. We’ll start with the strategies that have the highest profit factor for the NQ futures contract. The backtest will include the following futures contracts:
6B - British Pound (FX)
6E - Euro (FX)
CL - Crude Oil
ES - E-Mini S&P 500
FDAX - DAX
GC - Gold
NQ - E-Mini NASDAQ 100
RTY - E-Mini Russell 2000
YM - Mini Dow
ZB - 30 year Bond
ZN - 10Year Note
ZS - Soybeans
ZW - Wheat
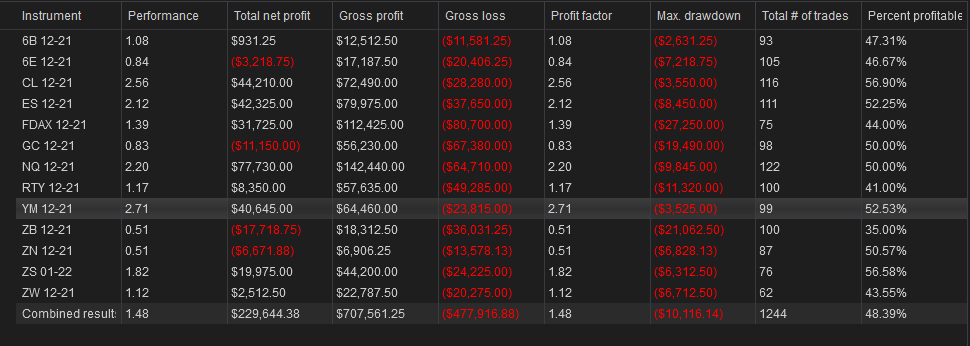
Here’s the first backtest for Strategy 36:

This backtest is based on data from November 1, 2020 to November 1, 2021.
As you can see, Strategy 36 continues to perform well with NQ. It has a slightly higher profit factor than it did in the original backtest from August 31, 2020 to August 31, 2021, but it also performs well with CL (2.56 profit factor), ES (2.12 profit factor), ZS (1.82 profit factor) and YM (2.71 profit factor). It did not do well with currencies, gold, or bonds. In fact, it performed so poorly with bonds (.51 profit factor) that the inverse strategy might be worth looking at. We will be investigating this relationship further.
What’s Next
It is our goal to drop at least one backtest per week based on the instruments listed above. These will be short posts and not all posts will be available to the public, but our hope is to develop any trends we find among certain asset classes before the new year. We also plan on doing another backtest on the most relevant crypto crosses, micro contracts like MNQ, and certain stocks in the NQ index.
While the holy grail of trade strategy should work regardless of the market, our hope is to use the fundamental knowledge of what we can expect from the market in 2022 to make some predictions about the best markets and strategies to use to take advantage of what may become a once in a lifetime event. It will also help to understand/gauge the strength of each strategy and what it is mechanically that makes those strategies more robust than others. To learn more about what makes a strategy robust, click here.


No comments:
Post a Comment