We all want to believe there’s a way to measure the forward strength of a model, but the best you can do is make predictions about the future based on strategy performance and then track that performance, as well as the rationale for your predictions, over time. We use profit factor as the primary basis for that prediction, but there are a host of attributes we track in our search for the holy grail of automated trade strategy.
This is why we publish updates every two months to track the progress of strategies. We like to look at how our top automated trading strategies are performing and update you on our key findings, highlights, takeaways and what’s in the pipeline. The following post is our January update. You can view past updates here:
What Are We Looking For In These Updates
We are looking for one thing in particular: consistency. When we say consistency, we mean strategies that perform like the backtest, specifically with regard to profit factor. We are tracking our best strategies to find the best strategy attributes. We can then use these attributes to create a strategy that gets us closer to the holy grail of automated trade strategy.
We define the holy grail of trade strategy as having the following attributes:
- Profit factor greater than 3
- Annual drawdown less than 3%
- Annual return greater than 500%
- Maximum daily low of -$1,000
- Avg Daily profit greater than $1,000
- Less than 5,000 trades annually
- Greater than 253 trades annually
For this update, we have an additional task. We need to cull the field a bit and this post will serve as documentation for that process. In total, we are sharing the performance statistics on 43 of our strategies. At the end of this post, our focus list will fall to 27 strategies. We will continue to update all 43 strategies every two months and you will continue to see some of them updated on a weekly basis in The Mudder Report, but only 27 strategies will make the final cut. The new list will serve as a way to focus our efforts, while the old list will serve as a reminder for how far we’ve come.
With that, let’s dive into the update.
November Vs. January
So where do we stand in comparison with our last update?
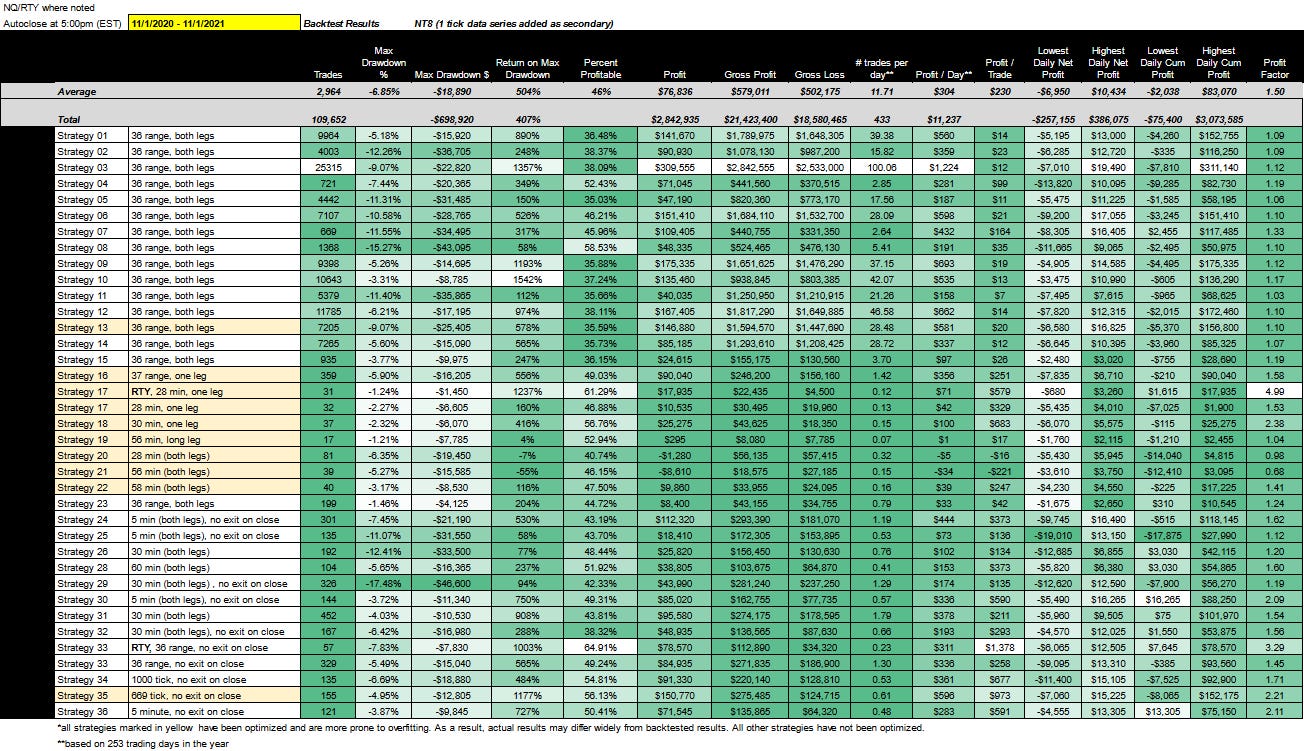
The table below provides the backtest results from our last update: 11/01/2020 - 11/01/2021
For links to all strategies click here.
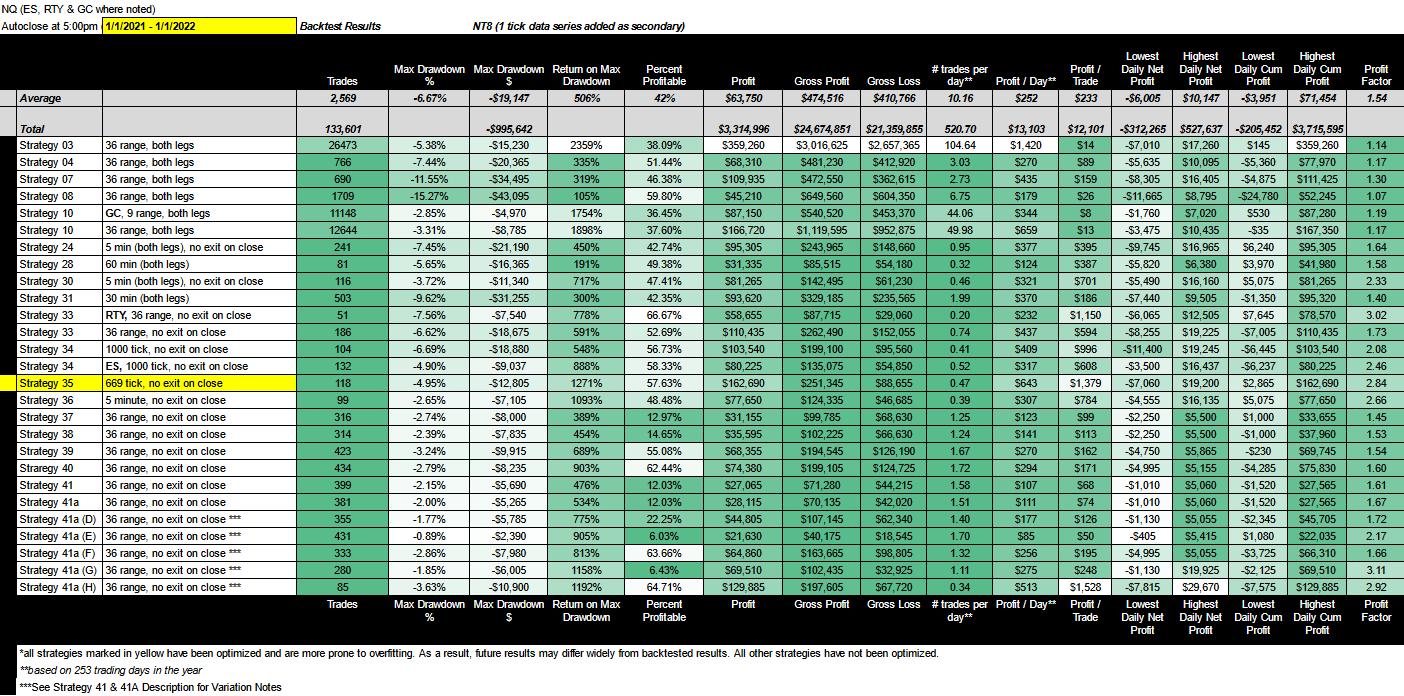
The following table provides the backtest results for the current or most recent update: 01/01/2021 - 11/01/2022
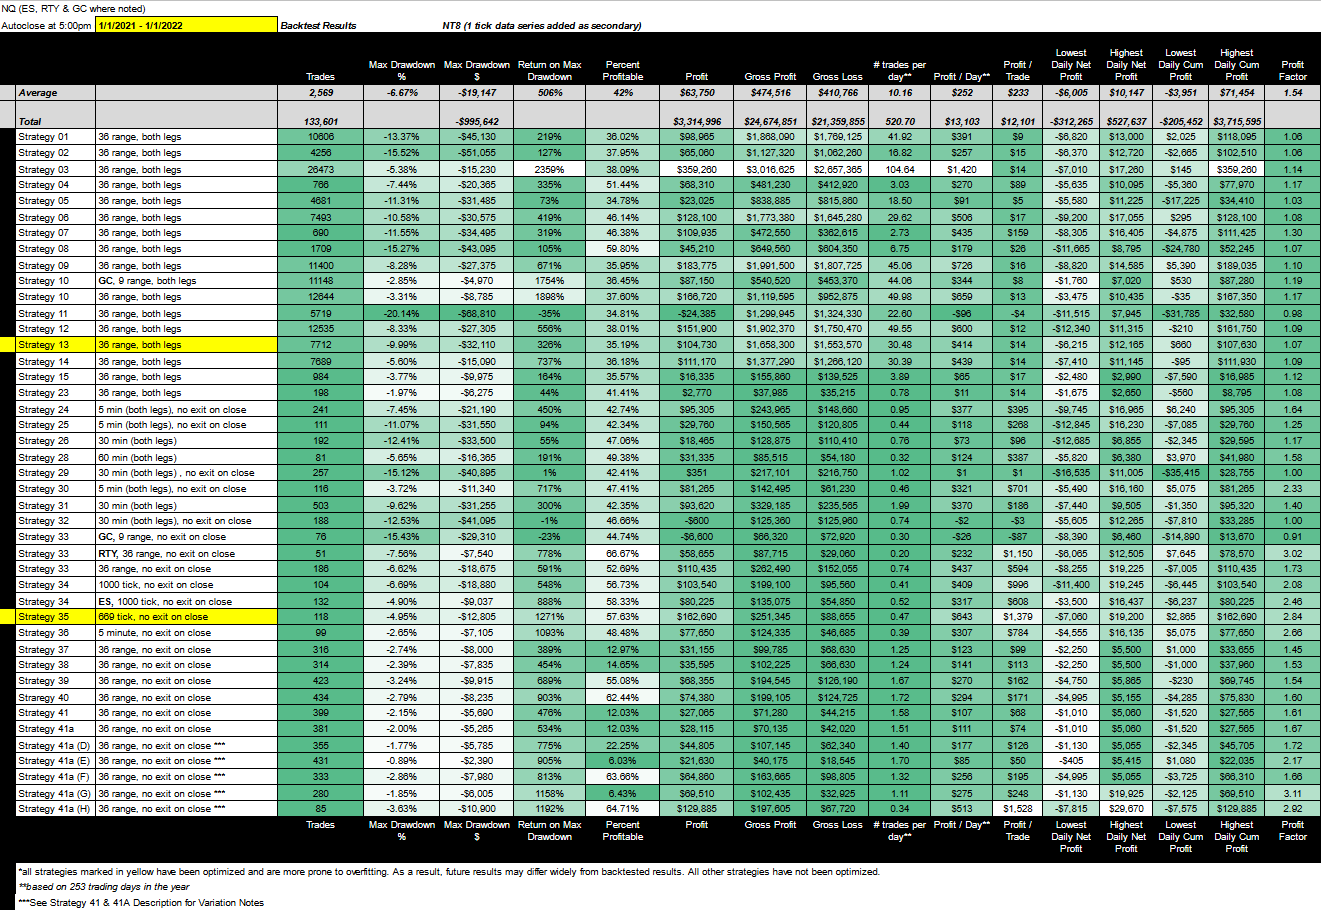
Strategies with less than 50 trades for the year were not included.
First, let’s review what the trend was coming into the January update.
In general, we had a deterioration from July to September. Profit per day decreased from $388 to $355 and profit per trade decreased from $145 to $116. Most of the deterioration occurred with optimized strategies. When we removed optimized strategies the metrics improved. What we’ve found over the year is that as much fun as optimized strategies are to ‘hunt’, they are more prone to overfitting and therefore have highly inconsistent results.
Moving into November, net profit for the total portfolio was basically flat, decreasing slightly from $2,788,075 to $2,746430, but the portfolio profit factor increased from 1.24 to 1.35 on fewer trades. Profit per day decreased from $355 to $304, but profit per trade increased from $116 to $230. Even though net profit decreased, it was a leaner and more efficient portfolio.
Moving into January, net profit for the total portfolio increased from $2,746430 to $3,314,996, and the portfolio profit factor increased from 1.50 to 1.54. In addition to a higher profit factor, we also have a slightly lower max drawdown percentage. Profit per day continued to decrease from $304 to $294 and profit per trade decreased slightly from $230 to $224.
We’ve been at this for a year, and we’re going to talk about more of our insights in the upcoming annual report, but what I’d like to do now is compare the January 2022 update with the May 2021 update. The May 2021 update is the first update we had where profit factor was used to track performance.
The following chart was from the May 2021 update:
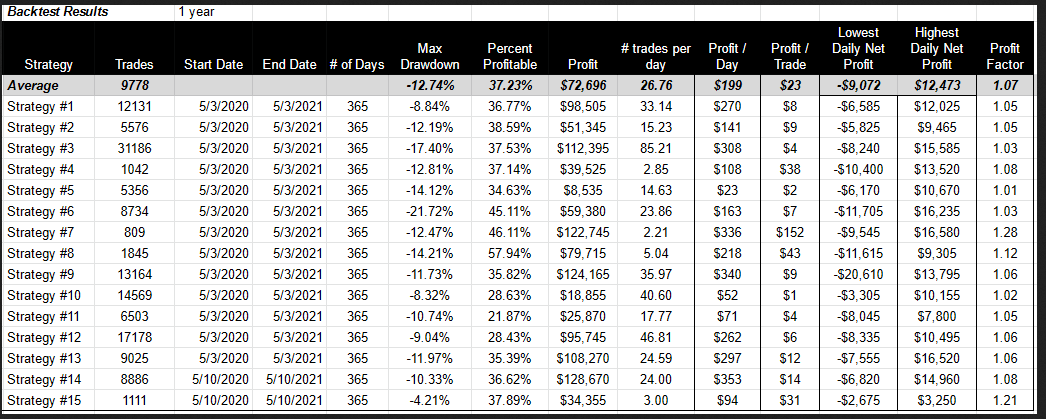
The average profit factor was 1.07. The average profit factor for the same strategies after the January 2022 update was 1.11, which is fairly consistent. Still, only a few of our first 15 strategies offer the kind of performance we’re interested in continuing to research. Going forward, we’re going to focus our attention on Strategies: 3, 4, 7, 8, and 10. So that’s an overview of our first 15 strategies. Only 5 made the cut. Now, let’s look at how Strategies 23 through 36 performed.
Strategy 23 had a drop in profit factor from 1.21 to 1.08. Even though Strategy 23 continues to have one of the lowest draw-downs at 1.97%, we don’t like the inconsistency and we really don’t like the low net income. As a result, we will no longer be studying Strategy 23.
Strategy 24 had a profit factor of 1.62 on the last update, and a profit factor of 1.64 on the January update. This is the kind of consistency we’re looking for in a higher profit factor strategy. Profit per trade went down from $395 to $373 on fewer trades, and drawdown remains fairly high at 7.45%, but we’re going to continue to study it.
Strategy 25’s profit factor jumped from 1.12 in the November update to 1.25 in the January update, which is highly inconsistent. In addition, it has a low net profit and a high drawdown at 11.07%. We will not be studying this strategy going forward.
Strategy 26 is one of our most consistent strategies from a stats perspective, but 1.17 is still a low profit factor and it made only $18K for the year on a 12.41% drawdown. We will not be studying this strategy going forward.
Strategy 28 only made 81 trades from January 1, 2021 to January 2, 2022, but it maintains a consistently high profit factor at 1.58, down from 1.60 in the last update. We will continue to study Strategy 28 due to its profit factor, consistency and high profit per trade at $387, but the return on max drawdown is a concern at only 191%.
Strategy 29 performed poorly and has a high drawdown, so we will not be studying Strategy 29 going forward.
Strategy 30, coming in at only 116 trades for the year, is one of our best performers with a profit factor that increased from 2.09 to 2.33. This may seem inconsistent, but at this level of gross profitability all we wanted to see is a profit factor greater than 2.09, and we got it. Strategy 30 also has a relatively low drawdown at only 3.72%, a return on max drawdown of 717% and a net profit of $81K. We will definitely continue to study this strategy.
Strategies 31 and 32 are both marked by high volatility. Even though the return on max drawdown is only 300% for Strategy 31, we’re going to continue to study due to the high number of trades. Strategy 32 performed poorly. It was one of only two strategies that had a negative net profit in 2021. We will no longer be studying Strategy 32.
Strategy 33 has always been one of our favorite strategies. Strategies 34 and 35 are the same as Strategy 33, but they are use a different data series. The strategy tested well on other contracts like RTY and GC, so we decided to track all three (RTY, GC and NQ) on the performance chart. What does the most recent update tell us about Strategy 33?
- The gold (GC) backtest was a disappointment, so we’re no longer going to study GC.
- The RTY backtest showed a profit factor of 3.02, down from 3.29 in November. The inconsistency is worrisome, but 3.02 is still high. The only issue with this backtest is the low trade count at 76 trades on the year, but those 76 trades made $58K.
- The NQ backtest saw an increased profit factor from 1.45 to 1.73 on 186 trades and $110K in net profit.
- If we move to Strategy 34, we’re looking at the 1,000 tick data series for the same strategy. Both NQ and ES performed well with profit factor’s over 2.00.
- Strategy 35 is the same as Strategy 33 and 34, but we used an odd data series on it — 669 ticks. This was a mistake made on the data pull, but the results were so good that it seemed almost irresponsible not to report. So, we included Strategy 35 as an ‘optimized strategy’ with an implied warning — in other words, we were very concerned with its consistency. Our concerns have been somewhat allayed because the profit factor for Strategy 35 increased from 2.21 on 155 trades to 2.84 on 118 trades. Net income increased from $150K to $162K for the year and return on max drawdown increased from 1177% to 1271%. We continue to be impressed by Strategy 33 and its ability to perform well using various instruments and data series.
Strategy 36 also performed well with a profit factor that increased from 2.11 to 2.66. While it only made 99 trades for the year, it has a low drawdown at 2.65% and a net profit of $77K. We will also continue to monitor Strategy 36.
Strategies 37 through 41a(H) were all published after the November update so we’re going to wait until the March 2022 update to assess.
Our New Target List
Our research list has gotten smaller, but strategy performance is improving over time, which is all we can ask for. From a holy grail perspective, we’re only going to focus on the following strategies:
Doing this allows us to focus our efforts for future ATS Research.
We will continue to provide periodic updates on all strategies. We will also continue to track some of the strategies that have been removed from the list on a weekly level in the Mudder Report.
Update Summary
We started this journey down one road. As expected, that journey sent us in many directions. Today we are focused on three paths. There’s strong evidence to suggest that the holy grail of automated trade strategy might be at the end of one (or perhaps all) of these paths. Each path is focused on a different theory about the nature of the holy grail, which we believe is either all or one of the following:
- a static strategy
- a static strategy with a profit factor of 1 that flips based on certain market conditions
- a moving target made up of several strategies
My favorite theory is still #2, though it is proving to be the most difficult to study.
We’re also working on a theory that the holy grail of automated trade strategy might be a scalping strategy. We’ve already found a strategy with over 400 trades and a profit factor greater than 4, but the net profit, as can be expected, is small. The challenge with scalping strategies is making enough profit per trade to cover expenses, i.e. commissions.
The key to finding the holy grail for all three theories as outlined above is to document, narrow and refine. Our bi-monthly updates—like the one you are reading now—along with The Mudder Report and additional backtest research, are meant to share the process with you.
One thing is certain, we’re closer than we were last year and we couldn’t have done it without your support.
Answers to Some Commonly Asked Questions:
- Perhaps one of the most commonly asked questions we get is, how much do I need to get started? This is hard to say because it depends on many things, but ultimately you want to set your simulated account to an amount that is equal to the max drawdown plus some amount to buffer for negative attributes like a low profit factor, high drawdown, commission, slippage, etc. For more on what we think is the best way to approach this question for yourself, click here.
- We continue to receive questions about funded trader programs. In particular, some of you are on the hunt for a strategy that will pass the funded trader program. On our last update we told you not to subscribe if that’s what you’re looking for. That said, in the last month we did discover Strategy 41a(E). It is the strategy with the lowest drawdown at .89%, but it only made $21K in 2021. Based on the backtest, it will get you there, but it might take some time. For more on what we think about the best way to approach funded trader programs click here.
- In general, one of the most common questions we get pertains to the use of our strategies on other assets like crypto. You can read more about that in the post: Do our strategies work on cryptocurrencies?
- Another commonly asked question is in regards to overfitting. You can read the following posts to learn more about overfitting and what we’ve done to reduce its impact: Overfitting: What is it and what can we do about it and What Are We Doing To Ensure Backtest Accuracy? A few months later, we received a question regarding strategy strength and what optimization tools we’re using to increase robustness. We answered that question in the post: How Can You Tell If An Automated Trading Strategy Will Perform Well Over Time?
- One of our subscribers told us that the strategies were too hard to understand. To this we say, “Ask us anything. We’re here to help.” Practice on Strategies 1 and 5 (both are free) first and then ask us if you have any questions. Also, unlike most websites, we give you a full description of the strategy so you can see and play around with the full mechanics of the strategy.
- At least once a day I receive an email telling me that our free strategies (Strategies 1 and 5) aren’t any good. We agree, that’s why we’re giving them away. The goal is to show you how our process works. Many people think we’re just selling strategies, but that’s not the case, we’re on a hunt. We are all on the same hunt and we’re stepping up to take the lead as guide. We use our strategies as a way to raise money for some of the projects we’re trying to do related to the hunt, but our goal is to find the holy grail of automated trade strategy. When the two goals diverge we always steer toward the latter.
- One of the most commonly asked questions we get is: How do I learn how to create automated strategies for myself? Our advice is to use the resources provided by Ninjatrader (we receive no remuneration for saying this). Just go to their Youtube channel and sign up. It’s free and there are many videos to learn from.
- We recently received a question about rigged markets. In particular, he was worried about something referred to as front-running. I’ll be posting a response to this shortly. Hopefully it will debunk many of the myths around ‘rigged markets’. The truth is, what most people think of as rigged, traders have been working with for years. There is little room for regulation in free-markets. This isn’t health care, it’s literally “the market”. There are no nets, nor should there be. Unfair play is fair play.
- Some
of you have requested that we use the payoff ratio rather than profit
factor to measure the strength of our strategies. We use profit factor
to measure the strength of our strategies. Profit factor is calculated:
Gross profit / Gross loss = Profit Factor
Payoff ratio is calculated:
Average winner / Average loser = Payoff Ratio
We prefer profit factor because unlike the average win/loss ratio, also known as the payoff ratio, it tells us immediately if the strategy was profitable or not. The payoff ratio tells you about the average trade, while the profit factor tells you about the total strategy. In order to understand if the strategy was profitable in aggregate, you would need to multiply the payoff ratio by the % of profitable trades or the win rate. The ideal strategy is one that offers a high win rate and a high payoff ratio.
- For the sake of the hunt, let’s create two scenarios to reinforce the difference between profit factor and payoff ratio:
Scenario #1: If you have a strategy with a payoff ratio of .92 and a win rate of 63%, it means on average your win/loss ratio is .92 so you’re losing money on every trade, but you win more than you lose, so you’re making a profit.
Scenario #2: If you have a strategy with a payoff ratio of 11.36 and a win rate of 12%, it means on average you make 11x more than you lose on each trade, but you only win 12% of your trades.
- The holy grail of trade strategy might have a payoff ratio of 11.36 and a win rate of 63%. We have yet to find the holy grail of trade strategy, but the first scenario profiled above belongs to Strategy 40 and the second scenario belongs to Strategy 41.
What’s in the pipeline:
We’ve done a lot since the last update:
- We looked at how well our strategies do when backtested with the Gold (GC) Futures in the post: How Well Do Our Strategies Work On Gold (GC) Futures?
- We looked at which strategies are best for trading micro E-mini futures contracts in the post: Which Automated Trading Strategy Is Best For Trading Micro E-mini Futures Contracts?
- We looked at which strategies are best for trading the ES futures contract in the post: Do Our Strategies Work On The E-Mini S&P 500 Futures Contract (ES)?
- We developed several theories about the best way to select strategies to trade at the end of each week in the post: Mudder Report Analysis:
How to select the best automated trade strategies for the upcoming week...
When we first started this project a year ago we only published 9 strategies. Last week, we published our 41st strategy and it met 5 out of 7 of criteria for the holy grail of automated trade strategy. So we’re close, but not there yet. Here’s what we have planned for 2022 to get us there:
- Our first annual report will go out at the end of the month. It will include longer-dated backtests as well as a brief discussion of each strategy.
- In the first six months of 2022, we plan on including backtests for:
additional futures contracts like CL, FDAX, YM and bonds
FX and cryptocurrency
single stock picks
- We are looking into other platforms for our strategies as well as a few portfolio analysis options that might help to pull out additional insights for better strategy formulation. We’re also looking at testing other data feeds, which is quite expensive.
- We’ve hired someone to start running our weekly selection for the Mudder Report on Collective2 for live/daily updates starting in March. Hopefully, we’ll have a process down by then. By the way, if you run one of our strategies on Collective2, let us know and we’ll pub it for you here. You can read more about Collective2 in the post:Question: Can I Use Your Strategies To Make Money On Collective2?
- We’re also going to start publishing new strategies only on the 1st and 15th of the month starting in February. Some of you have asked for more consistency here and I think this will help to allay those concerns.
- We are slowly making progress on our weekly update series — The Mudder Report. We’ve had some setbacks, but we’re learning a lot. Our goal is not to predict or recommend what to trade in the following week (it’s always fun to try your luck on a simulated account, but if you use the weekly update to trade live, you will get burned). Our goal in developing the Mudder Report is to aid in the development of a few working theories for the holy grail of automated trade strategy.
Finally, on January 21, we are transitioning to our new subscription format. To read more about the transition, click here.
If you have any questions, feel free to contact us directly at automatedtradingstrategies@substack.com or by responding directly to this post.
No comments:
Post a Comment