Technically, the market is about to take a dive in Q1. It's going to be brutal unless the Fed comes in and starts buying, which it very well might do. I'll talk about why I don't think that's going to matter in a moment. First, let's revisit bitcoin.
As advised, we hit a bottom in bitcoin in Sept/early Oct and then started trending up. We passed 13,500 by the end of October. Then we made new highs and now we're trading at 23,440.90.
I told you to get in at 11,000 in October and now we're at 23,440.90. We doubled our stack!
I'm a HODLer, so I don't sell bitcoin, but if you're in this for the trading opportunity, now is the time to take profit.
Don't fret, another opportunity is coming.
What about equity futures?
I'm putting myself on the line here, because I know the Fed can come in and start buying up assets at any time (to the point of insolvency), but I think the pressure is going to be so strong, it won't matter.
The Pressure
The pressure started last March. It's been gaining momentum all year. At some point, the bow will break and nothing will be able to stop it. That's just how the technical market goes.
The Federal Reserve has warned of this. They've been staunch advocates of direct stimulus, but politics has made direct stimulus difficult. So now we're in a pressure cooker and all it takes is one spark. That spark is 12,000. That's the RUBICON.
How will it happen?
The chart below is a daily Nasdaq futures chart. It's showing us that we need to start to selling when the Nasdaq breaks through 12,000. There might be a slight pullback on that, but it will continue down and it will continue for at least 30 days.
There will also be a pullback at around 10,000. If the market continues through 10,000 -- hold on to your horses because we're in for a wild ride.
What Else Can You Do?
I'd also start looking at buying gold (offshore) and if you own equities, focus on companies that are in countries that had a large direct stimulus package.
It shows that Japan has been the leader of the pack on
spending as a percentage of GDP. Japan started direct payments before COVID to stave off deflation. That's where the Fed got the $1,200 figure from to begin with (10,000 HK = $1,200 US). Japan
made the first direct payment in what is referred to as a helicopter
drop by the Fed. In fact, Japan did it just before the market tanked in the US
(February 2020). And, they've continued to be the front-runner in this
effort.
So, my money is on Japan. Specifically, I'm looking at companies/start-ups that rely primarily on Japanese spending.
I'll provide more commentary at the end of January. Until then, short US stocks, buy gold and companies that rely on Japanese spending, and HODL bitcoin.
As advised, we hit a bottom in Sept/early Oct and then started trending up. We passed 13,500 by the end of October.
Now that we've passed 13,500, technical charts are showing a target of 18,000 and possibly new highs by the end of the year depending on momentum. Level of support is 15,000 to 15,300.
To figure this out, we need to create a model. The model is based on the following assumptions:
1 dollar = 10,000 Cointiply coins
1 Cointiply coin = $0.0001 dollars
1 bitcoin = 56,300 US dollars
1 bitcoin =563,000,000 Cointiply coins
Now let’s make some basic assumptions about your level of activity on Cointiply.
There’s the main faucet, which can be boosted by increasing your Cointiplier (we’ll talk about how to do that in a moment).
There’s also offer walls (visiting webpages, downloading apps, watching videos), surveys, videos, and paid to click ads.
You
can also boost your earnings temporarily and permanently by playing the
game Cointivity, which is a little mining game created by the folks at
Cointiply (we’ll talk about this a bit later as well).
Last but not least, you can earn 5% interest on your balance if you have over 35,000 coins, which isn’t hard to do.
Let’s take a minute to model out how much you can make on each, starting with The Faucet.
The FAUCET
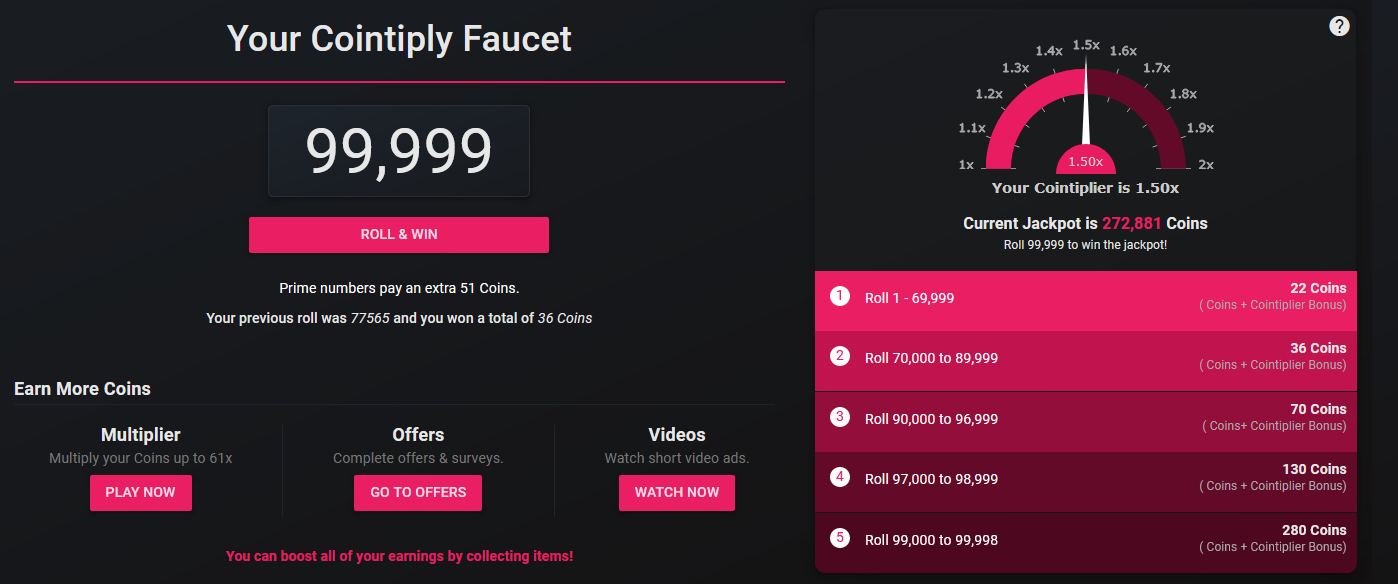
Cointiply has one of the best faucets out there. It’s attached to a progressive jackpot, which as of now is for 272,881 coins.
On average, I make around 30 coins per claim, but you can make anywhere from 22 to 280 coins. The amount depends on the roll.
For
the purpose of creating a model, let’s assume you make 22 coins per
roll and roll the faucet as often as the faucet allows (24 times a day
or once every hour). If you do this, you will make 385,440 coins, $38.54
or 0.0006846181172 bitcoin in one year.
Seems small I know, but just wait.
Important:
This is our baseline. I doubt you’ll be able to make a claim every hour
on the hour, but you may also make more than 22 coins per claim, so it
all evens out, especially because only a small portion of your payout is
going to come from the faucet (unless you win the jackpot of course).
The largest portion of your bitcoin will come from offers and maximizing
those offers, which you’ll see in a minute.
Note:
This baseline amount includes the loyalty bonus, which doubles your
reward. You get a loyalty bonus of 1% for every day you make a claim on
the faucet up to 100%. So as long as you make at least one claim per
day, you will receive the loyalty bonus.
Offer Walls
Cointiply offer-walls are a great way to earn coins. According to the website, top users earn 100’s of thousands coins
from offer walls. The most popular offer walls are Theorem Reach, Tap
Research, Adscend Media and Adgate Media. There are more than a dozen
others. They are all different, so find one you like and work it. The good news is you have variety.
A
single survey or offer can pay as much as 300,000 coins, with many
paying between 1,000 and 20,000 Coins. There are many offers for both US
and non-US players.
Tip: always click on “Earn Coins” first. You will see a list of the most popular offers as well as any new ways to earn additional coins.
Some
offers are for games and others are surveys or simply ads to click on.
Games and offers pay the most, while pay-per-click ads pay the least (9
coins per click). Cointiply paid-to-click ads are pretty normal. You
earn coins for visiting a webpage and they’re available all around the
world.
Watching
videos is one of the most passive ways to earn coins because all you
have to do is pull up a video and have it streaming. My favorites are
VideoFox, EngagMe and
Hideout.tv. You need to see 3 ads before your account will be credited.
The same applies to Hideout.TV. You earn points for every three ads
that play between videos.
For our earnings model, let’s say you can commit to doing four offers per month that average out to 50,000 coins per offer.
That’s a total of 2,400,000 coins per year or $240.
Now let’s add videos.
Let’s
say you can commit to watching two hours of video every day. You don’t
really have to watch, just have it on. You are allowed to watch video
from three different portals (cell phone, desktop, tablet) at one time.
For the purposes of this exercise, we are going to be conservative and
just use one portal for 2 hours per day. That’s a total of 43,797 coins
per year or $4.38.
Next: What if we add interest to our model?
Earning Interest
Cointiply pays 5% annual interest on coin balances over 35,000 coins.
To earn interest, you have to maintain this balance and make at least 1 claim each week.
To start earning interest, you need to go to the settings page and toggle the “Enable Interest” switch and then save your settings. Interest is paid every Sunday night.
As
a word of caution, be sure to place a 2FA on your account if you have
enough to earn interest. You can find the 2FA set up in settings.
Interest
is calculated using an annual interest rate of 5% paid out once a week
based on your average daily balance. For example, if you have 100,000
Coins for a 1 week period you will earn 99 Coins interest for that week
(100,000 * 0.05126 / 52.14). Based on our numbers above (approximately
7,400 coins per week) that equates to 370 coins per year. Not much, but
you don’t have to do anything for it.
Next: Now let’s look at how much we can make on offers, games, video and paid per click ads.
So where does that put us?
If we add offers, videos and interest to our annual tally we get:
2,831,958 coins
$283.20; and,
0.005030120818
Two things to keep in mind:
when
we first started this project, bitcoin was worth around $10,000 so
these numbers are not static. For example, bitcoin extraordinaire, the
person that introduced me to bitcoin, Max Kaiser predicts bitcoin will be trading at $240K by the end of the year. So he’s predicting an almost 500% growth rate this year.
This amount is based on both conservative and aggressive assumptions.
So now that you know about all the ways to earn bitcoin on Cointiply, let’s talk about how you can boost earnings.
The Cointivity Game & It’s Impact On Earnings
This is perhaps the main reason I like Cointiply so much — there are so many ways to boost your earnings. The Cointivity Game gives you the ability to boost your earnings.
How much can it boost earnings?
The following is an overview of how much we’ve earned so far using the model:
As you can see, the largest percentage of your earnings come from doing offers. So you can really maximize your earnings by doing two things:
Increase the number of offers you do from once per week to every day.
Boost your earnings potential on the day that you do those offers by purchasing “items”.
If
we increase the number of offers per week from once per week to seven
per week, we can increase annual earnings from $283 to $1,724.
Cointivity Maximization Strategy:
Select one day a week to do all 7 offers and then purchase items that boost earnings for that day.
To understand this, first a little tutorial on how to purchase items.
CointiPoints
are Cointiply’s reward point system. For every 10 coins you earn ,
you’ll receive 1 CointiPoint. The more Cointipoints you have, the higher
your level. You can also use these points to buy “items”. The “items”
are used for your “bitcoin mining business”.
The
goal is to collect as many items as possible to be successful with your
bitcoin mining business. However, you can only collect items if you
have a “slot” to place the item in.
Each level you go up unlocks more “slots”, which allows you to have more items.
Now, let’s figure out what kind of “items” you can place in your slots.
Items: Equippables Vs. Consumables
Everyone
starts off with 2 slots: 1 for Consumables and 1 for Equippables. Every
time you unlock another level, you also get more slots to put your
items in. Remember, you want lots of items because they boost your
earnings, but you have to have slots to place them in.
There are two types of “items” that you can buy to help your mining business: Equippables and Consumables.
Consumables are items that are consumed or used in a short period of time. They are short-term in nature and the earnings boost from consumables is temporary.
Equippables are items that are part of your equipment. They are long-term in nature and they boost your earnings permanently.
Each
item is also classified as Common, Uncommon, and Rare quality. Rare and
Uncommon items boost your earnings higher than Common items.
Where can you find items?
In Pods. You can buy Pods with either CointiPoints or coins. Every Pod contains three items. The higher quality the Pod, the higher your chance of getting Uncommon and Rare items, which are worth the most.
In these Pods you will find “items” like the ones below.
We’re not done. There are also Cointivity Collections.
Cointivity Collections
Cointivity
Collections are a way to get an even higher earnings boost. This is a
great way to maximize earnings if you know you’re going to be on
Cointiply for 4 to 72 hours.
Each
collection requires a different group of items. The most valuable
Collection also has the most Rare and Uncommon Items. Here’s a graphic
from the website of the Collections currently available:
When
you have all items in a Collection, a “LOCK IN” button appears on that
Collection. Click the button, and you will be asked to confirm that you
wish to activate the Collection.
TIP:
If you know you’re going to have a big offer day, you might want to
Lock In your Collection on the day before and then activate it on the
day you are going to do the offers.
All
of your items are part of your “Inventory”. So, at any point in time
you can check to see how many items you have by clicking on Inventory.
You can check out your level, your boosts, your slots, and the items you
have in those slots by clicking on your Cointivity Profile. Also
remember, that you can use the items to boost earnings or you can sell them for coins.
Let’s get back to maximizing strategy.
Our model assumes that on the day we complete 7 offers, we also purchase:
three Equipables that permanently increase the offer reward by 2% each
two Consumables that temporarily increase the offer reward by 3% each
one Collectible which temporarily boosts my offer account by another 7%.
By doing this I can increase annual earnings from $1,724 to $2,147.
If
we assume that Max Keiser is right, and bitcoin is going to grow by
another 500% by year end, the amount could increase to $8,000 by the end
of the year. And that’s just in 1 year!
Two more things before I send you off to start your bitcoin mining business — Chat Rain and Cointiply Multiplier.
Next: Chat Rain
Chat Rain
Chat
Rain is an opportunity to make a portion of the Chat Rain pool. I’ve
never made much on Chat Rain, but I want to include it here even though I
don’t include it in the model because you don’t really have to do
anything for it.
At
the top of the Cointiply Chat forum is a water drop icon, along with
how many coins are in the current Rain pool. Cointiply does not tell you
how big the Pool needs to be before it “rains”, but you can see what
your current share is by looking at the Progress Bar. When the Rail pool
is paid out, the site literally rains. The rain looks more like
snowflakes than rain, but it’s cute.
The
amount you can make depends on how many coins you earn for that day.
The more you earn, the higher your share of the Chat Rain pool. You can
also donate to the Rain pool, but it doesn’t increase your share so I
don’t know why people do it. Karma?
Important: You have to opt in to the Chat Rain pool by clicking on the “Tap to Qualify for Rain Pool” button.
Next: Cointiply Multiplier
Cointiply Multiplier
I’m
not a big fan of gambling, so I didn’t mention this in the opening
remarks. You want to earn and hold (or hodl as the bitcoin community
likes to say). That said, if you’re into this for the gambling, you can
wager as few as 10 coins or as many as 50,000 coins in Cointiply’s
multiplier game. The maximum multiplier is 61.3x so you could make as
much as 613 coins from a 10 coin wager, but it’s highly unlikely.
When
you start a new round of the CointiPly Multiplier you will be presented
with 11 different “targets” on the screen. The targets look like small
white circles. If you win, you can either press your luck or play it
safe and click the “Take Win” button at any time to claim your coins and
end the round.
What’s Next
I’ll be researching the impact of referrals and premium memberships on earnings.
If
this has been at all helpful for you, please pass it on to your friends
and family and do let me know if you have any questions.
Get your orders in. We're on our way up to $13,500 by the end November 2020.
The chart below was taken at the end of September. We were in a period of consolidation while the market decided on which way to go, a breakout south or a continuation with the trend that's been established over the last 6 months.
Time to get your buy orders -- we're going higher.
“It's only when the tide goes out that you learn who's been swimming naked.” -Warren Buffett
If you follow any market for an extended period of time you will notice certain patterns in price action. In particular, you will notice that the market moves in waves. It is pushed in certain directions by large buyers and sellers in the markets. These large buyers and sellers have the ability to change the direction of the wave pattern. And, when they all align you get a tsunami. Just like the guy trying to find that monster wave, traders are on the look out for the same phenomena.
At what point do you know the wave is about to "break"? This is the million dollar question, because in surfing and trading, timing is everything.
One of my favorite tools to use in trading are trend-lines. Trend-lines help you to see where the "break" is.
Trend-lines are used to find the trend, but they also tell you when the trend has changed direction. That is, when another large buyer or seller has entered the market and changed the direction of the prevailing trend. If the dominant trend is up and a major player comes in and starts selling, it will push the trend in another direction. This push causes a "break" in the trend. In the world of trading this is referred to as a breakout.
Let's take a moment to familiarize ourselves with the following chart. This is my own chart setup on Ninjatrader 7. We're looking at a price chart of NASDAQ futures (my favorite instrument to trade).
For now, disregard the bottom half of the chart and just focus on the top segment. Also disregard the green, yellow and orange lines -- we'll talk about what those mean later. For now, just focus on the candlesticks and the blue lines. The blue lines are trend-lines.
At first, you will notice blue lines following the trend up and then the trend changes and starts going down.
Now let's get laser focused on the first trend-line going up.
As you can see, the price bounces off the bottom of the trendline three times before finally gaining enough traction to continue upward. It doesn't quite reach the top of the trend-line before it starts trending down. This is when you start looking for a breakout.
The trendline supported the price three times before, and now
it's breaking through the trend line. This breach is the
breakout. Once you see the breakout, it's time to act. As you can see there are two breakouts. The first one is a breakout down and the second is a breakout up.
Both breakouts represent an opportunity to "ride the wave". The trend is up, another wave comes in and starts selling and changes the wave pattern down. The push is so strong that it forces the trend to change direction and that change in direction is marked by a breakout.
In trading, there is no sure thing. The best thing you can do is find an indicator that works 75% of the time. One way to boost your accuracy is by confirming the direction of the breakout with another indicator.
Now we can look at the bottom part of the chart. The breakout down is confirmed with a down movement by both of the bottom indicators. The second breakout is also confirmed by an up movement by both of the bottom indicators.
Now what? Once you find the breakout you want to place a trade with a take profit (TP) that's at least 2x as much as your stop loss (SL). For example, once I see the first breakout I'm going to place a trade with a SL of 40 ticks and a TP at 80 ticks. Some traders like to go for 3x or 4x. That depends on your risk. When you're first starting out, I think it's safe to go for 2x. This way, if you get one trade wrong and one trade right, you're still up.
This is by far my favorite set up. If you have any questions, post them in the comments below or email me at celanbryant @ gmail.com.
At
a time when when the major tenants of investment valuation have been
undermined, investors are looking for a confirmation -- a confirmation
that the fundamentals aren't lying.
Technical analysts study price trends. We look for patterns that play out regardless of the asset being traded.
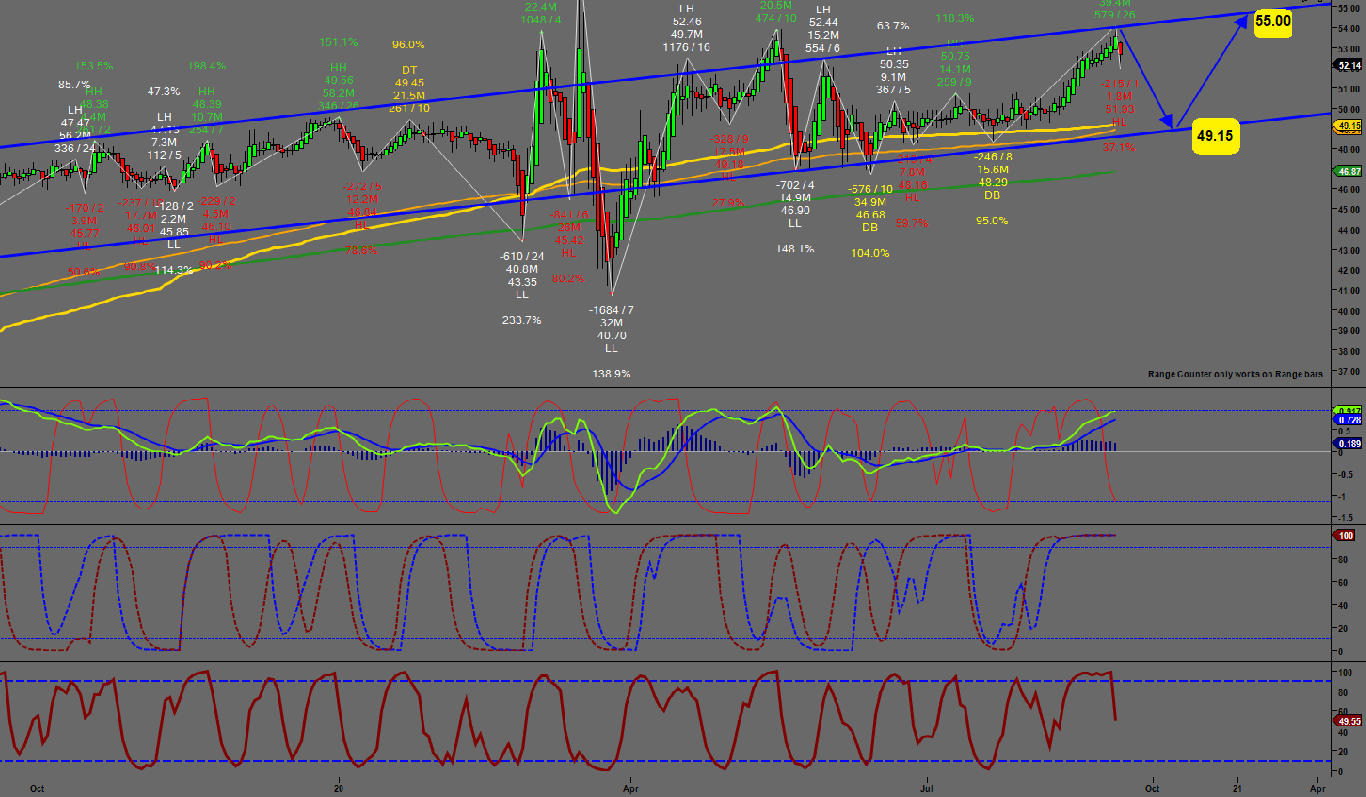
Campbell Soup has been trending up for the past 2 years, but the trend is reversing in the short-term.
Long-term
play: Buy the pullback. Both the trend-line and the moving average
converge around $49.15, which is the best place to put your buy order.
Short-term play: You can sell now with a take profit at $49.15. Or, you can buy at $49.15 and take profit at $55 even.
From
Edo-period Japan, where traders applied technical analysis to profit
from Osaka’s rice futures market, to the 1930's Wyckoff Method still
taught in major trading houses today, technical trading withstands the
test of time. That's because it's based on price patterns and those
price patterns are based on human behavior. Specifically, trading is
based on auction mechanics.
So, at a time when the major tenants of investment valuation have
been undermined, is it any wonder that technical trading is gaining in
popularity again?
How can you trust a DCF model that assumes a positive risk-free rate?
How can you trust a P/E ratio when companies are sacrificing dividends for stock buybacks.
How can you trust an economy with stock prices that move in the opposite direction of earnings?
In other words, now, more than ever, investors are looking for a confirmation -- a confirmation that the fundamentals aren't lying.
Technical analysts study price trends. We look for patterns that play
out regardless of the asset being traded. That's why technical analysis
works for everything from rice in Osaka Japan to soup companies like
Campbell's (CPB).
Fundamentally, Campbell Soup Company excels in both good and bad
times. In other words, people find a use for its products no matter
what's happening in the world.
Here's what the CEO had to say on the last earnings call:
“In the quarter, we experienced unprecedented
broad-based demand across our brands as consumers sought food that
delivered comfort, quality and value. This demand resulted in double-digit increases
in organic sales, adjusted EBIT and adjusted EPS. In addition,
Campbell’s products were purchased by millions of new households, with
total company household penetration increasing over 6 percentage points
in the quarter compared to the third quarter of fiscal 2019.”
We can see this upward trend play out on the technical level as well.
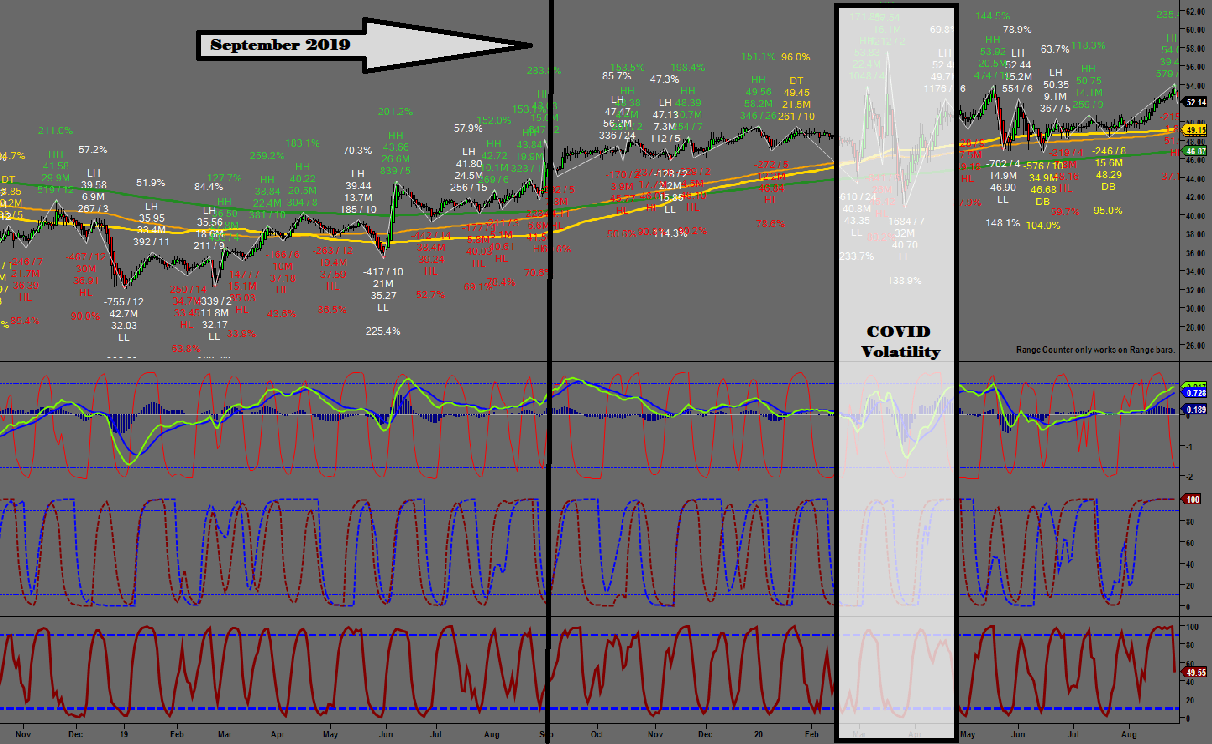
The chart below is split into 4 segments. The top
segment is the price chart and the bottom 3 segments are the technical
indicators I use to confirm the price trend. As you can see from the top
segment of the daily price chart below, the company has been trending up since the beginning of 2019.
For now, let's just focus on the upper part of the chart. The black
vertical line is where the company was in September of 2019. The white
box is the period in time that the market rallied due to COVID. The
yellow and green lines represent the moving average. As you can see, the
market likes to use the moving average as a point of support and
resistance. This is because institutional traders like to buy and sell
at these areas.
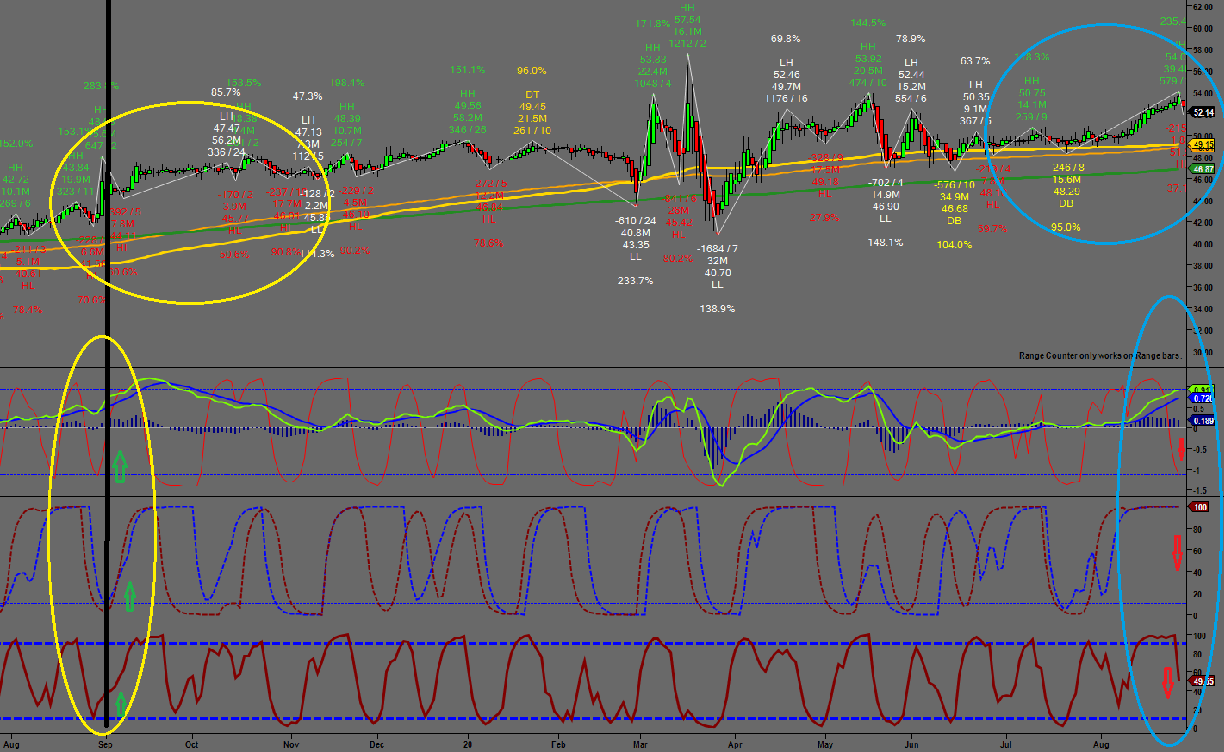
Now, let's look at the bottom part of the same chart (see below). We're going to compare last year (yellow circles) to this year (blue circles).
As you can see from the price chart at the top, marked by a yellow
circle, Campbell's took off in September of last year. Now let's look at
the three indicator charts below the price chart. In all three charts,
as noted by the green up arrows, the indicators are trending up, which
confirms the price trend.
We're coming up on the same time period for 2020. This is marked by
the blue circles on the right. The price is going up moving into
September 2020, but it looks like it's ready for a pullback.
Now let's look at the 3 indicator charts below the price chart for
confirmation. These indicators confirm that the price trend may be
reversing, at least temporarily. In all three charts, as noted by the
red down arrows, the trend is down or about to go down.
Conclusion: It would appear as though CPBs price is
trending up, but it's slightly oversold after the last earnings call so
investors can expect a minor pullback. The question is how far? We can
use trend lines to answer this question.
The chart below shows trend lines in blue. The trend was lost during the COVID rally, but soon returned to normal. We can use these blue trend lines to help extrapolate the price for the next 2-3 months.
As you can see from the chart below, we are at the top of the
trend line, so this is a bad time to purchase the stock for optimal
gain. Investment Recommendation:
Long-term play: Buy the pullback. Both the
trend-line and the moving average converge around $49.15, which is the
best place to put your buy order.
Short-term play: You can sell now with a take profit at $49.15. Or, you can buy at $49.15 and take profit at $55 even.
Disclosure: I/we have no positions in any stocks mentioned, and no plans to initiate any positions within the next 72 hours.