An auction is a system of buying and selling goods or services by offering them for bidding—allowing people to bid and selling to the highest bidder. The bidders compete against each other, with each subsequent bid being higher than the previous bid. Once an item is placed for sale, the auctioneer will start at a relatively low price to attract a large number of bidders. The price increases each time someone makes a new, higher bid until finally, no other bidders are willing to offer more than the most recent bid, and the highest bidder takes the item. -Corporate Finance Institute
This is the nature of a simple auction, but this isn’t how the futures market works. In a futures market the auctioneer is on a never ending search for price discovery.
The futures market is actually the result of tulip auctions conducted by Dutch traders in the 1600’s. They wanted to buy and sell tulips year round, not just for 3 months of the year. This is the beginning of what is known today as the Dutch Auction.
A Dutch Auction is when the auctioneer starts with a high asking price and lowers the bid until one of the bidders accepts the price. Items for sale are allocated based on the bid order: the first highest bidder picks their items, followed by the second highest bidder, and the third highest and so on. Dutch auctions are often used for commodities and investment securities. Alphabet (Google) had a famous example of a Dutch Auction —Google’s Dutch Auction.
So what? This means that in a Dutch Auction new information can come in and change the direction of the market at any time. This new information acts like a wind that changes the direction of the price wave.
So, in a Dutch Auction, new information isn’t immediately digested into the market — it is a process that is based on bid order and that process usually plays out in threes. First, you will see an initial push or “price attempt” to change the direction. The first move is the initial test and is followed by a pullback. Then you will notice a second attempt, which I like to refer to as the bandwagon trade. Then there’s the last movement before the price moves in the opposite direction. The price will continue to trend in either direction until it finds equilibrium.
This is the framework or template for price discovery in the futures market. The variables that impact this process the most are speed (tick per second) and volume or market depth. So, if you had to create a formula for the best conditions to trade it might look something like this:
Price Potential = Speed of price * market depth * market divergence/market orders
Where price potential is the potential change in price, speed of price is measured as ticks per second, market depth is measured in terms of volume expansion/contraction and market divergence is measured as (number of contracts traded / number of orders). Keep in mind, there will always be more contracts traded than orders because traders often trade more than 1 contract. We are currently in the process of developing a strategy that makes use of this formula as a way to define the best time to trade. We’re also using it as a barometer for knowing when to “flip” the strategy (make the opposite trade).
In general, the higher the potential, the better the trade. Low potential is marked by quick pullbacks and choppy markets. High potential is marked by strong price movements. Those movements can be either sideways or trending up/down. They can also be tracked by lines referred to as “trend” lines. If a price is trading within known trend lines it will hit a price on the line and then go the other way. In other words, the lines act as support and resistance for the price. When the price is pushed outside of these lines, it is referred to as a breakout.
Breakout Trades
You can confirm that new information has entered the market with breakout activity. It is also marked by an expansion in volume as well as an increase in the speed of the market. The best way to take advantage of a breakout is by tracking the trend line. When the price breaks above the trend line, you’ve got a breakout, which means new bidders/seller have entered the room and have changed the direction of the trend. In general, breakouts only happen 1 out of 3 times that a price hits the trend line.
So the market is a combination of trends and breakouts. And these trend line and breakout attempts are patterns that repeat over and over again. You can find this structure (3 movements) at every time frame of the market. If you drill down, you’ll find it at the 1 minute or 150 tick level. If you drill out, you’ll find it at the 15 min or 5,000 tick level. The same patterns exist at every level of the market. In this way, the market moves like a fractal. That is, it creates a pattern that repeats on itself. One of the best Youtube videos that explains this is below.
The point is, you will find the same patterns at the 36 range level that you will find at the 18 range level.
Here’s an example of a 36 range chart and 3 price movements marked as 1, 2 and 3.
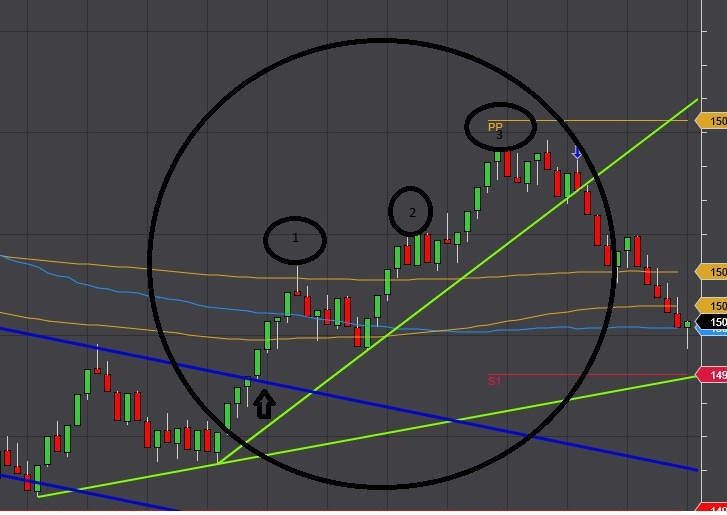
The trend line marked in light green supports all three movements. The price finally breaks below the trend line in a downward move. The movement starts with an upward breakout from a downtrend (marked by the blue trend line). If you’re a subscriber click here for instructions on how to use our favorite trend line indicator.
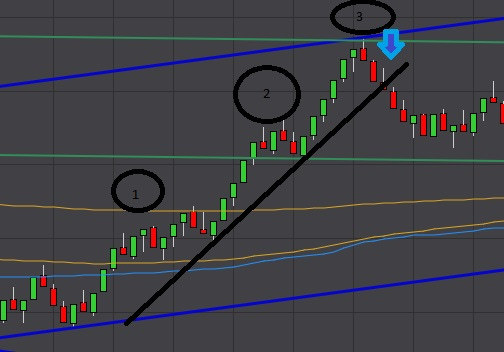
The chart above is a 36 range chart and the chart below is an 18 range chart. Specifically, this is a price chart of the first movement in the 36 range. It has three movements within it. And, if you look closely, you will see that the first movement in the 18 range also has three movements within it. Again, the market is a fractal.
This is a common pattern in trading due to auction mechanics.
From a candlestick perspective, this is referred to as the three bullish soldiers — each bar going higher than the last. To those that follow candlestick patterns, this is a very bullish signal.

And then of course there’s the great Richard Demille Wyckoff — one of the most well known traders in history. In the early 1900’s, Wyckoff developed a strategy around market mechanics and named each segment of the trade (1, 2 & 3) Spring, Throwback and Correction.
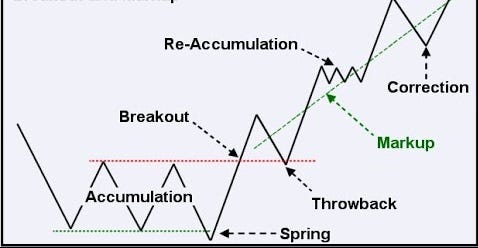
From a market mechanics perspective these movements are marked by an accumulation and distribution phase — accumulation leads to an increase in price while distributions lead to a decrease in price. Wyckoff’s book is still taught on Wall Street because market structure is a function of the underlying dutch auction. You can view a pdf of his original work on the Internet Archive by clicking here.
How Can We Use This To Help Us Find The Holy Grail of Trade Strategy?
We are still on the hunt for the holy grail of automated trade strategy. If we apply the rules of market structure, we can use it to look for two events that are certain to happen:
1) bandwagon movements
2) breakouts
Like most strategies, we are searching for an event that takes place within a condition and then we to need to define the action to take within that event. In this case, the event is a bandwagon movement or a breakout and the action is a buy or sell order with a trailing stop and possibly a limit order on entry. The trick (or the part we’ve failed at thus far) is to define the conditional that describes the price action just before the bandwagon movement or breakout occurs.
To learn more about who we are and our quest for the holy grail of trade strategy, click here.
A common question we get is, ‘do you teach’? The answer is no. None of us have any interest in teaching at the moment, but we can give you a recommendation. If you’re interested in learning more about futures trading or automated trading we recommend taking classes from Quantra. They’ve been around for over 10 years and have a mix of free and paid classes. Before signing up for anything, however, check out the credentials of Quantra’s faculty and compare it to other online schools. You’re looking for a mix of academic, practical, and institutional experience.

No comments:
Post a Comment