This is the first of a series of posts based on research requests submitted by subscribers of Automated Trading Strategies. Our goal is to find the holy grail of automated trading strategies.
We’ve defined the holy grail of trade strategy to be the following (based on annual performance):
Profit factor greater than 3
Annual drawdown less than 3%
Annual return greater than 500%
Minimum daily net profit of -$1,000
Avg Daily profit greater than $1,000
Less than 5,000 trades annually
We have yet to find this illusive trade strategy, but we’re on the hunt! If you subscribe to our newsletter, you’ll be among the first to find out when we do.
While we share our answer with all subscribers, only paid subscribers can request research.
This subscriber wanted to know what the impact of optimizing strategies based on time period would be.
Before answering this question, I want to explain how we compare results with the chart below. I also want to explain what the Profit Factor (last column) is.
Profit Factor
Here’s a chart showing the performance of our strategies over the past year.
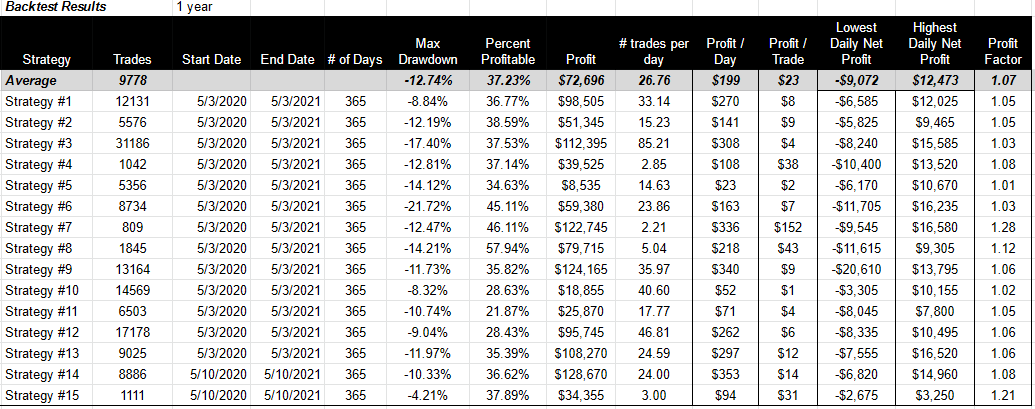
For a description of each strategy click here.
Please pay close attention to the profit factor in the last column. This is our primary performance indicator. One of the main goals of this publication is to find a strategy with an annual profit factor greater than 3. We refer to it as the holy grail of trade strategy.
Profit factor is a function of gross profit and loss. It is the ratio of the two. So when gross loss equals gross profit we have a profit factor of 1.
One thing we’ve learned after running hundreds of strategies through simulation is that most strategies trend toward a profit factor of 1. In a nutshell, this is because the markets tend to revert to a mean.
Intuitively, it isn’t surprising to learn that when strategies are linked together by an indicator, they tend to have a gross loss and a gross profit that are remarkably similar over a 365 day period. So then the question is:
Is it possible to identify, isolate and reverse portions of gross loss. If we can’t reverse the loss, maybe we can just eliminate the bad trade altogether. This brings us back to time.
What Does Profit Factor Have To Do With Timing?
Timing is an aspect of the trade that we can isolate. We can find the hours of the day, in general, that the trade is most successful and only trade those hours. We can even optimize just one leg of the trade.
So, we optimized all our strategies and this is what we found:
In general, the profit factor (gross profit / gross loss) increased by 15-25% when we optimized the strategy based on the strategy’s most profitable trading hours.
The impact was particularly high for the long leg of the trade.
To be clear, reducing the time period reduces net profit, but increases gross profit compared to gross loss. The end result is a strategy that is more efficient and reliable allowing you to increase your contract size over time.
What’s Next
Now that we know that timing can increase the profit factor by 15% to 20%, we want to continue our research by researching reversion to the mean theories.
Specifically, we want to know:
If profit margin on all strategies tends to trend toward 0 or a profit factor of 1, is there a way to capitalize on this truth?
Is it possible to achieve a higher profit factor using strategies based on reversion to the mean theory?
As an example, we are currently looking at implementing mean reversion indicators like Bollinger Bands into our automated trade strategy and will share those strategies with subscribers of Automated Trading Strategies when complete.
No comments:
Post a Comment