 |
| Strategy #5 |
If you've read any of my previous posts you know that I'm a big fan of three things:
- Trading Futures
- Liberty and Economic Justice (Blockchain / Bitcoin)
- Automated Streams of Income
This post touches on all three categories; it ties trading NASDAQ futures to automated trading strategies, which can lead to economic freedom.
So what's the catch?
The catch is that you have to find profitable trading strategies.
What is an automated trading strategy?
Automated trading (also referred to as algorithmic trading) is a trading strategy that makes automated trades based on a set of inputs or a program that you create. Traders like to use automated strategies to remove emotion from the decision making process when making trades.
For example, here's a description of the automated trading strategy we refer to as Strategy #5.
This strategy made over $15K in 1,000 trades between 10/18/2020 and 1/6/2021. It made 13.16 average trades per day and had an average daily profit of $194, which is a profit of $15 per trade:
Strategy #5 uses the MACD Indicator (MACD), Double Stochastics (DS) and the Relative Spread Strength (RSS). These are all commonly provided by trading platforms for traders to include on charts.
So what do you do with these indicators?
You use them to develop a strategy and then you automate that strategy.
Here’s how you would describe and automate Strategy 5:
Enter Long - When MACD (MACD plot) crosses above MACD (Avg plot), with a look back period of 2, AND, when DS with an RSS input series, is greater than 90.
Exit Long - When MACD (MACD plot) crosses below MACD (Avg plot).
Enter Short - When MACD (MACD plot) crosses below MACD (Avg plot), with a look back period of 2, AND, when DS with an RSS input series, is less than 10.
Exit Short - When MACD (MACD plot) crosses above MACD (Avg plot).
For MACD, use 26 as the Slow parameter, 9 for Smooth, and 12 for fast.
For RSS, use 10 for EMA1, 40 for EMA2, and 5 for Length.
You can test this strategy by duplicating our results (see the chart below).
This is what the strategy looks like in chart form:

Which automated trading strategies are the best and how do you you know?
This is what we do -- we hunt for high performing automated trading strategies for the NQ futures contract.
We've tested over 500 strategies and we're sharing our best performing strategies with you.
The following are the best performing strategies:
Backtest Results based on ~1,000 trades

Backtest Results based on 1 year of trades
Our results are based on how well the strategy performs after 1,000 trades and how well it does after one year of trading. Then, we compare each strategy based on the following attributes:
Drawdown - This refers to the maximum drawdown statistic, which provides you with information regarding the biggest decrease (drawdown) in account size experienced by the strategy. Drawdown is often used as an indicator of risk.
Drawdown = single largest Drawdown
As an example, your account rises from $25,000 to $50,000. It then subsequently drops to $40,000 but rises again to $60,000. The drawdown in this case would be $10,000 or -20%. Take note that drawdown does not necessarily have to correspond with a loss in your original account principal.
Profit - The net profit made on the strategy for the backtest.
#trades per day - The average number of trades made per day using the strategy.
Profit / Day - The average profit made per day.
Profit / Trade - The average profit made per trade.
Lowest daily new profit - The worst performing day of the strategy in the backtest.
Highest daily net profit - The best performing day of the strategy in the backtest.
So, how much can you make using automated trading strategies?
If you were to trade 1 NQ contract on each of our 9 strategies listed above, you could have made over $1.2 million in 2020**.
Backtest Results based on 1 year of trades
You can have access to a description of all strategies with a subscription to our newsletter: Automated Trading Strategies on Substack. A subscription gives you the opportunity to use and copy our best strategies.
Our highest performing strategy made over $270K last year.
As a subscriber, you'll also be the first to receive strategy performance updates as well as new strategies added to the list.
You will also receive:
The ability to download the strategy into NinjaTrader 7 (not available for NinjaTrader 8)
A detailed description of how to duplicate the automated strategy.
If you're already a subscriber, all strategies are available below:
Automated Trading Strategies: Strategy #1
Automated Trading Strategies: Strategy #2
Automated Trading Strategies: Strategy #3
Automated Trading Strategies: Strategy #4
Automated Trading Strategies: Strategy #5
Automated Trading Strategies: Strategy #6
Automated Trading Strategies: Strategy #7
Automated Trading Strategies: Strategy #8
Automated Trading Strategies: Strategy #9
Download Instructions
Strategies are made available by description (like the description for Strategy #5 above) and/or as a download for Ninjatrader 7. If you're having difficulty creating an automated strategy with the description, please contact us directly at celanbryant @ gmail.com.
Ninjatrader 7 download instructions:
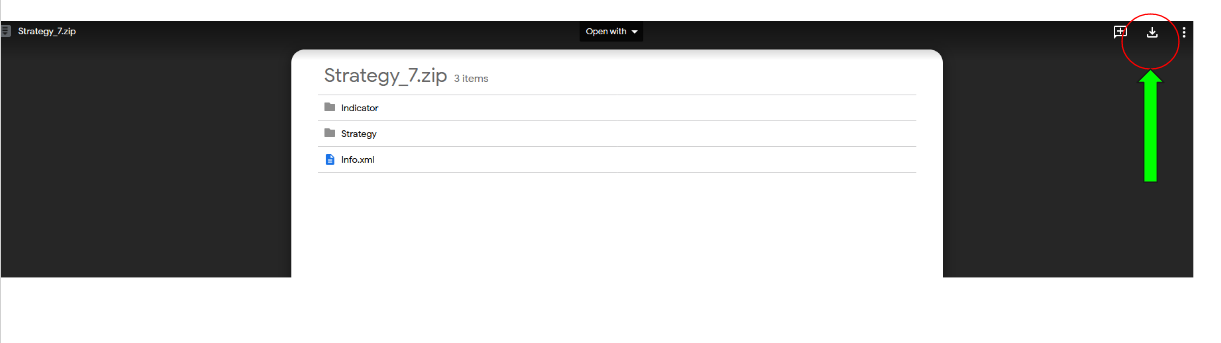
Click on the link within the post to download file from GoogleDrive.
Download the Strategy to your desktop, keep them in the compressed .zip file.
From the Control Center window in Ninjatrader 7, select the menu: File> Utilities> Import Strategy.
Select the downloaded .zip file.
NinjaTrader will then confirm if the import has been successful.
If you've never used an automated strategy in NinjaTrader 7, NinjaTrader provides instructions here.
Subscribe to Automated Trading Strategies
**There is no guarantee that these strategies will have the same performance in the future. We use backtests to compare historical strategy performance, but there are no guarantees that this performance will continue in the future.
No comments:
Post a Comment