Summary
- At a time when when the major tenants of investment valuation have been undermined, investors are looking for a confirmation -- a confirmation that the fundamentals aren't lying.
- Technical analysts study price trends. We look for patterns that play out regardless of the asset being traded.
- Campbell Soup has been trending up for the past 2 years, but the trend is reversing in the short-term.
- Long-term play: Buy the pullback. Both the trend-line and the moving average converge around $49.15, which is the best place to put your buy order.
- Short-term play: You can sell now with a take profit at $49.15. Or, you can buy at $49.15 and take profit at $55 even.
From Edo-period Japan, where traders applied technical analysis to profit from Osaka’s rice futures market, to the 1930's Wyckoff Method still taught in major trading houses today, technical trading withstands the test of time. That's because it's based on price patterns and those price patterns are based on human behavior. Specifically, trading is based on auction mechanics.
So, at a time when the major tenants of investment valuation have been undermined, is it any wonder that technical trading is gaining in popularity again?
- How can you trust a DCF model that assumes a positive risk-free rate?
- How can you trust a P/E ratio when companies are sacrificing dividends for stock buybacks.
- How can you trust an economy with stock prices that move in the opposite direction of earnings?
In other words, now, more than ever, investors are looking for a confirmation -- a confirmation that the fundamentals aren't lying.
Technical analysts study price trends. We look for patterns that play out regardless of the asset being traded. That's why technical analysis works for everything from rice in Osaka Japan to soup companies like Campbell's (CPB).
Fundamentally, Campbell Soup Company excels in both good and bad times. In other words, people find a use for its products no matter what's happening in the world.
Here's what the CEO had to say on the last earnings call:
“In the quarter, we experienced unprecedented broad-based demand across our brands as consumers sought food that delivered comfort, quality and value. This demand resulted in double-digit increases in organic sales, adjusted EBIT and adjusted EPS. In addition, Campbell’s products were purchased by millions of new households, with total company household penetration increasing over 6 percentage points in the quarter compared to the third quarter of fiscal 2019.”
We can see this upward trend play out on the technical level as well.
The chart below is split into 4 segments. The top segment is the price chart and the bottom 3 segments are the technical indicators I use to confirm the price trend. As you can see from the top segment of the daily price chart below, the company has been trending up since the beginning of 2019.
For now, let's just focus on the upper part of the chart. The black
vertical line is where the company was in September of 2019. The white
box is the period in time that the market rallied due to COVID. The
yellow and green lines represent the moving average. As you can see, the
market likes to use the moving average as a point of support and
resistance. This is because institutional traders like to buy and sell
at these areas. 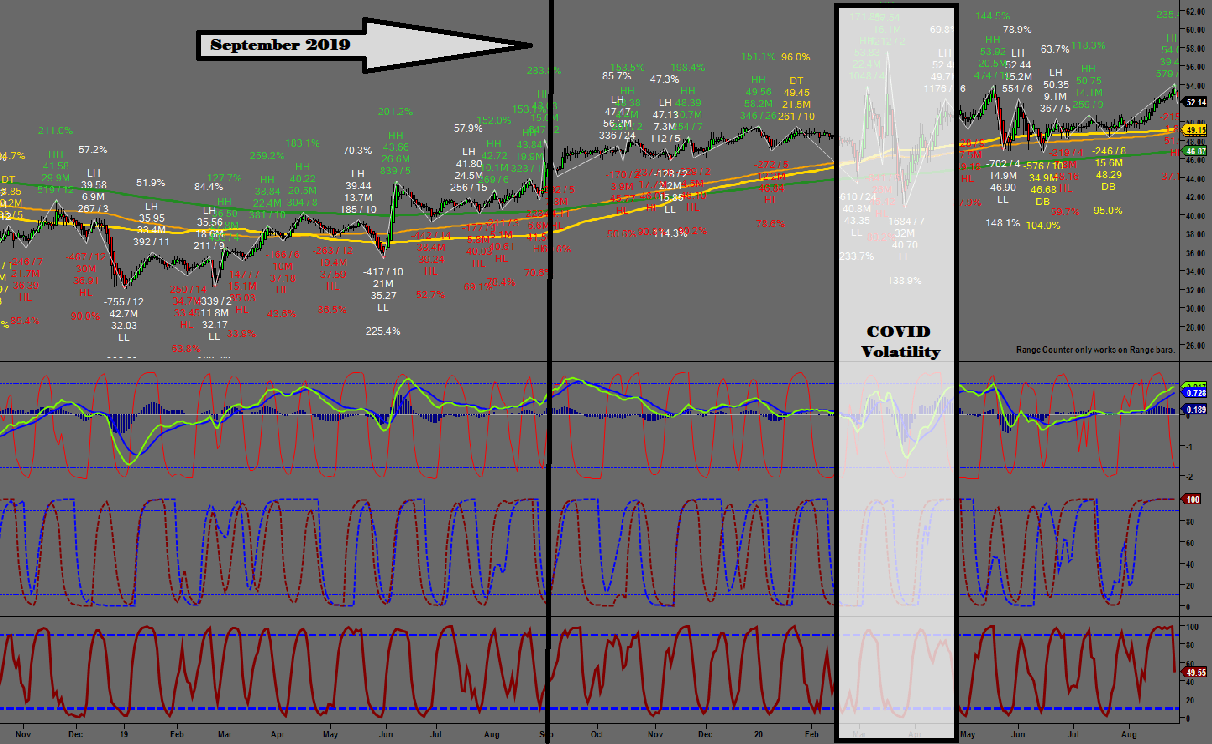
Now, let's look at the bottom part of the same chart (see below). We're going to compare last year (yellow circles) to this year (blue circles).
As you can see from the price chart at the top, marked by a yellow circle, Campbell's took off in September of last year. Now let's look at the three indicator charts below the price chart. In all three charts, as noted by the green up arrows, the indicators are trending up, which confirms the price trend.
We're coming up on the same time period for 2020. This is marked by the blue circles on the right. The price is going up moving into September 2020, but it looks like it's ready for a pullback.
Now let's look at the 3 indicator charts below the price chart for
confirmation. These indicators confirm that the price trend may be
reversing, at least temporarily. In all three charts, as noted by the
red down arrows, the trend is down or about to go down.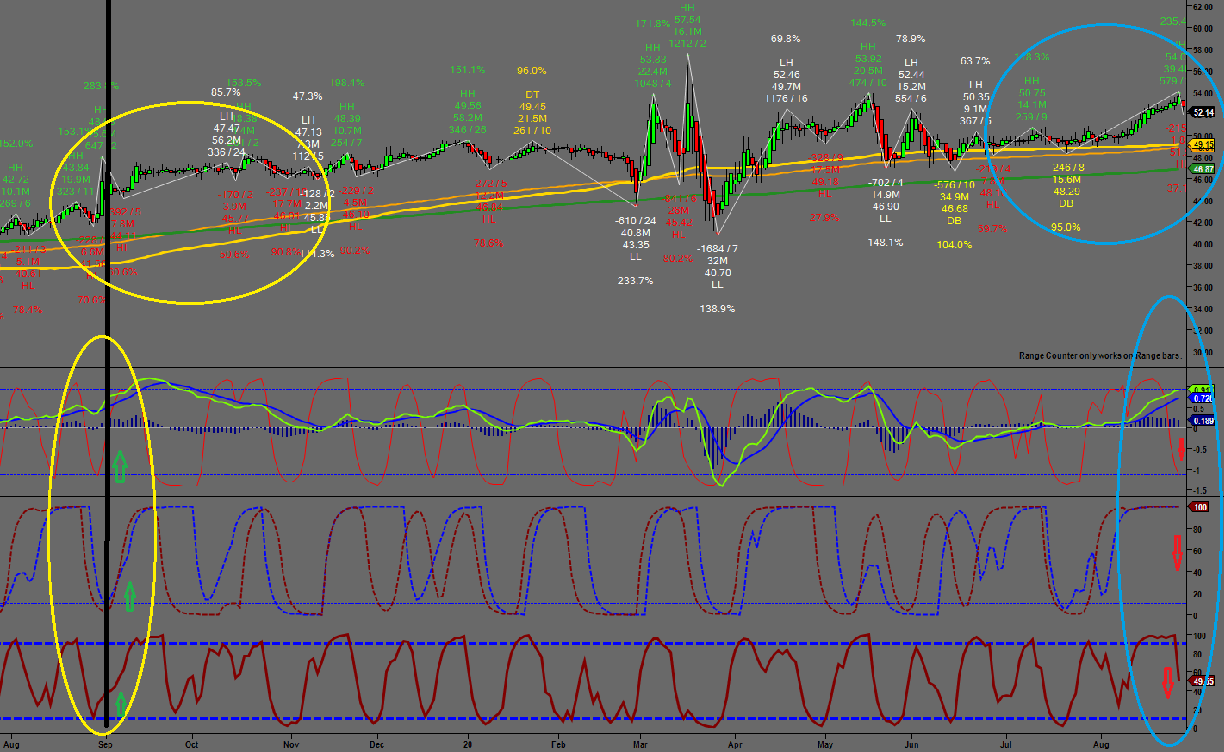
Conclusion: It would appear as though CPBs price is trending up, but it's slightly oversold after the last earnings call so investors can expect a minor pullback. The question is how far? We can use trend lines to answer this question.
The chart below shows trend lines in blue. The trend was lost during the COVID rally, but soon returned to normal. We can use these blue trend lines to help extrapolate the price for the next 2-3 months.

As you can see from the chart below, we are at the top of the
trend line, so this is a bad time to purchase the stock for optimal
gain. 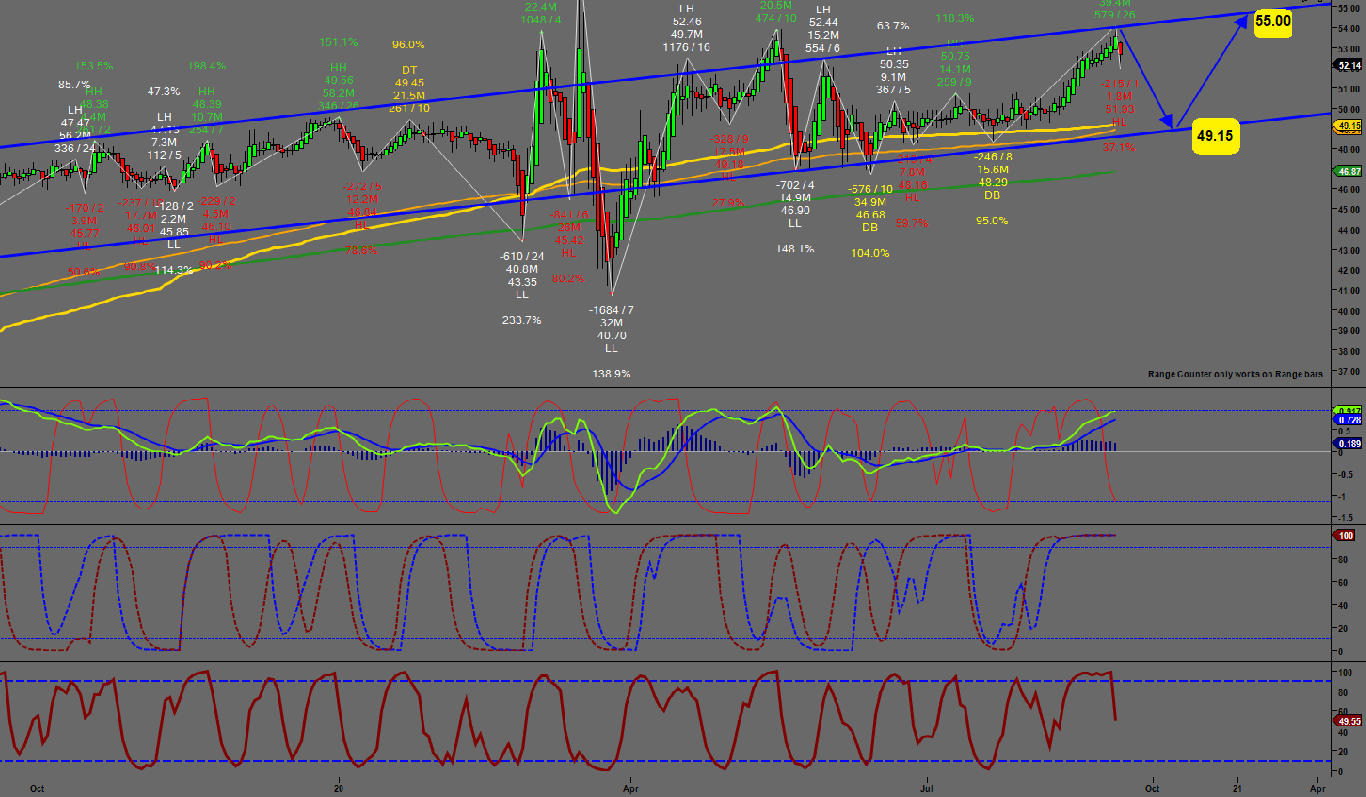 Investment Recommendation:
Long-term play: Buy the pullback. Both the trend-line and the moving average converge around $49.15, which is the best place to put your buy order.
Short-term play: You can sell now with a take profit at $49.15. Or, you can buy at $49.15 and take profit at $55 even.
Disclosure: I/we have no positions in any stocks mentioned, and no plans to initiate any positions within the next 72 hours.
No comments:
Post a Comment